Harley Davidson 2012 Annual Report Download - page 74
Download and view the complete annual report
Please find page 74 of the 2012 Harley Davidson annual report below. You can navigate through the pages in the report by either clicking on the pages listed below, or by using the keyword search tool below to find specific information within the annual report.-
 1
1 -
2
-
3
-
4
-
5
-
6
-
7
-
8
-
9
-
10
-
11
-
12
-
13
-
14
-
15
-
16
-
17
-
18
-
19
-
20
-
21
-
22
-
23
-
24
-
25
-
26
-
27
-
28
-
29
-
30
-
31
-
32
-
33
-
34
-
35
-
36
-
37
-
38
-
39
-
40
-
41
-
42
-
43
-
44
-
45
-
46
-
47
-
48
-
49
-
50
-
51
-
52
-
53
-
54
-
55
-
56
-
57
-
58
-
59
-
60
-
61
-
62
-
63
-
 64
64 -
 65
65 -
 66
66 -
 67
67 -
 68
68 -
 69
69 -
 70
70 -
 71
71 -
 72
72 -
 73
73 -
 74
74 -
 75
75 -
 76
76 -
 77
77 -
 78
78 -
 79
79 -
 80
80 -
 81
81 -
 82
82 -
 83
83 -
 84
84 -
85
-
86
-
87
-
88
-
89
-
90
-
91
-
92
-
93
-
94
-
95
-
96
-
97
-
98
-
99
-
100
-
101
-
102
-
103
-
104
-
105
-
106
-
107
-
108
-
109
-
110
-
111
-
112
-
113
-
114
-
115
-
116
-
117
-
118
-
119
-
120
-
121
-
122
-
123
-
124
-
125
-
126
-
127
-
128
-
129
-
130
-
131
-
132
-
133
-
134
-
135
-
136
-
137
-
138
-
139
-
140
-
141
-
142
-
143
 |
 |
74
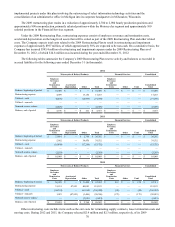
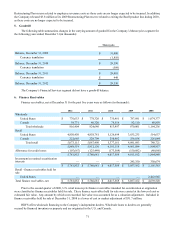
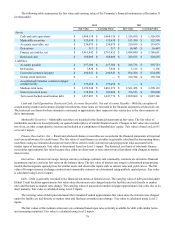
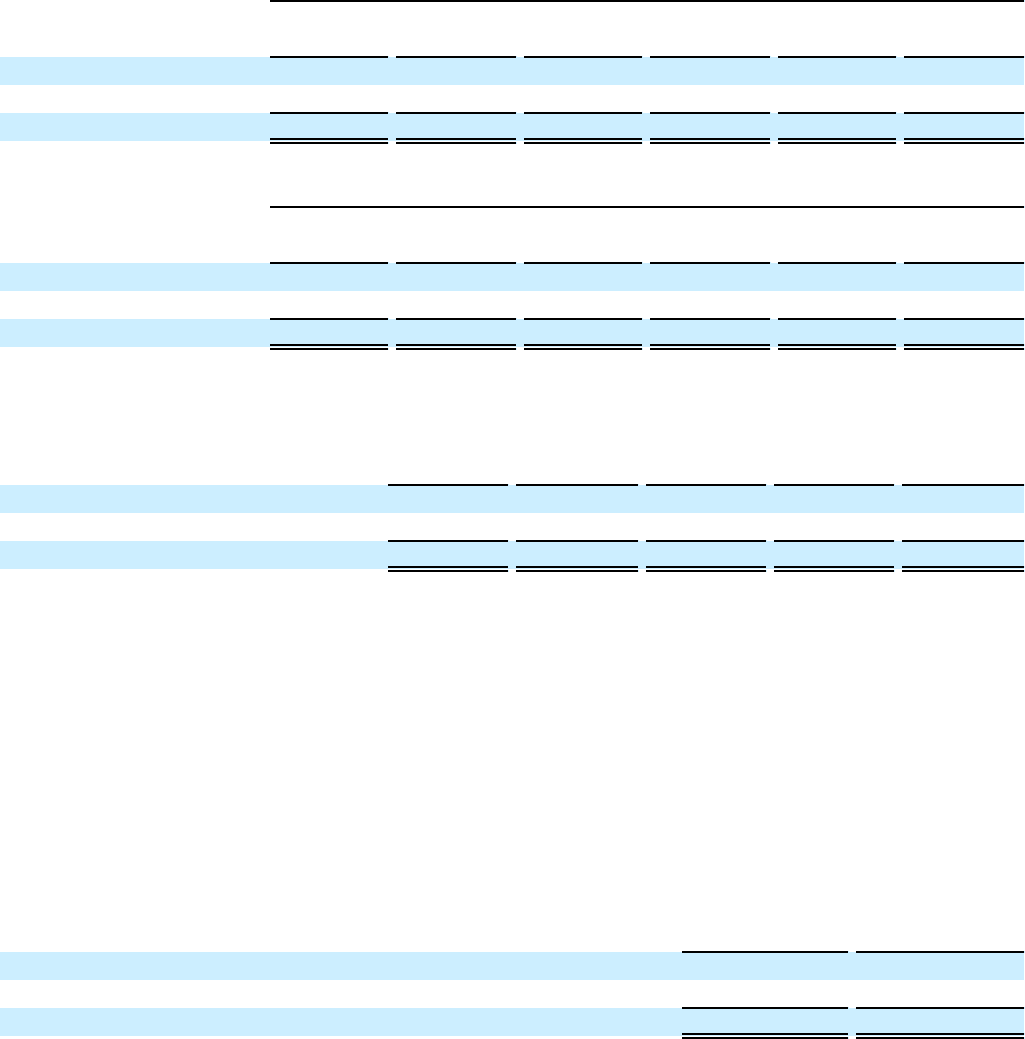
An analysis of the aging of past due finance receivables at December 31 was as follows (in thousands):
2012
Current 31-60 Days
Past Due 61-90 Days
Past Due
Greater than
90 Days
Past Due Total
Past Due
Total
Finance
Receivables
Retail $ 4,894,675 $ 113,604 $ 37,239 $ 27,597 $ 178,440 $ 5,073,115
Wholesale 814,706 984 278 436 1,698 816,404
Total $ 5,709,381 $ 114,588 $ 37,517 $ 28,033 $ 180,138 $ 5,889,519
2011
Current 31-60 Days
Past Due 61-90 Days
Past Due
Greater than
90 Days
Past Due Total
Past Due
Total
Finance
Receivables
Retail $ 4,915,711 $ 107,373 $ 36,937 $ 27,469 $ 171,779 $ 5,087,490
Wholesale 822,610 777 344 909 2,030 824,640
Total $ 5,738,321 $ 108,150 $ 37,281 $ 28,378 $ 173,809 $ 5,912,130
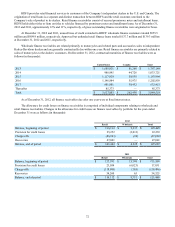
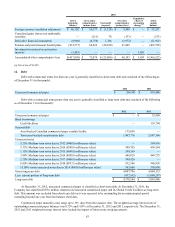
The recorded investment of retail and wholesale finance receivables, excluding non-accrual status finance receivables,
that are contractually past due 90 days or more at December 31 for the past five years was as follows (in thousands):
2012 2011 2010 2009 2008
United States $ 26,500 $ 27,171 $ 34,391 $ 24,629 $ 23,678
Canada 1,533 1,207 1,351 2,161 1,275
Total $ 28,033 $ 28,378 $ 35,742 $ 26,790 $ 24,953
A significant part of managing HDFS’ finance receivable portfolios includes the assessment of credit risk associated with
each borrower. As the credit risk varies between the retail and wholesale portfolios, HDFS utilizes different credit risk
indicators for each portfolio.
HDFS manages retail credit risk through its credit approval policy and ongoing collection efforts. HDFS uses FICO
scores, a standard credit rating measurement, to differentiate the expected default rates of retail credit applicants enabling the
Company to better evaluate credit applicants for approval and to tailor pricing according to this assessment. Retail loans with a
FICO score of 640 or above at origination are considered prime, and loans with a FICO score below 640 are considered sub-
prime. These credit quality indicators are determined at the time of loan origination and are not updated subsequent to the loan
origination date.
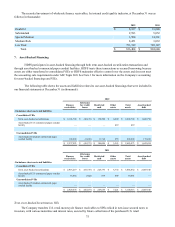
The recorded investment of retail finance receivables, by credit quality indicator, at December 31 was as follows (in
thousands):
2012 2011
Prime $ 4,035,584 $ 4,097,048
Sub-prime 1,037,531 990,442
Total $ 5,073,115 $ 5,087,490
HDFS’ credit risk on the wholesale portfolio is different from that of the retail portfolio. Whereas the retail portfolio
represents a relatively homogeneous pool of retail finance receivables that exhibit more consistent loss patterns, the wholesale
portfolio exposures are less consistent. HDFS utilizes an internal credit risk rating system to manage credit risk exposure
consistently across wholesale borrowers and individually evaluates credit risk factors for each borrower. HDFS uses the
following internal credit quality indicators, based on the Company’s internal risk rating system, listed from highest level of risk
to lowest level of risk for the wholesale portfolio: Doubtful, Substandard, Special Mention, Medium Risk and Low Risk. Based
upon management’s review, the dealers classified in the Doubtful category are the dealers with the greatest likelihood of being
charged-off, while the dealers classified as Low Risk are least likely to be charged-off. The internal rating system considers
factors such as the specific borrowers’ ability to repay and the estimated value of any collateral. Dealer risk rating
classifications are reviewed and updated on a quarterly basis.