Harley Davidson 2012 Annual Report Download - page 43
Download and view the complete annual report
Please find page 43 of the 2012 Harley Davidson annual report below. You can navigate through the pages in the report by either clicking on the pages listed below, or by using the keyword search tool below to find specific information within the annual report.-
 1
1 -
2
-
3
-
4
-
5
-
6
-
7
-
8
-
9
-
10
-
11
-
12
-
13
-
14
-
15
-
16
-
17
-
18
-
19
-
20
-
21
-
22
-
23
-
24
-
25
-
26
-
27
-
28
-
29
-
30
-
31
-
32
-
 33
33 -
 34
34 -
 35
35 -
 36
36 -
 37
37 -
 38
38 -
 39
39 -
 40
40 -
 41
41 -
 42
42 -
 43
43 -
 44
44 -
 45
45 -
 46
46 -
 47
47 -
 48
48 -
 49
49 -
 50
50 -
 51
51 -
 52
52 -
 53
53 -
54
-
55
-
56
-
57
-
58
-
59
-
60
-
61
-
62
-
63
-
64
-
65
-
66
-
67
-
68
-
69
-
70
-
71
-
72
-
73
-
74
-
75
-
76
-
77
-
78
-
79
-
80
-
81
-
82
-
83
-
84
-
85
-
86
-
87
-
88
-
89
-
90
-
91
-
92
-
93
-
94
-
95
-
96
-
97
-
98
-
99
-
100
-
101
-
102
-
103
-
104
-
105
-
106
-
107
-
108
-
109
-
110
-
111
-
112
-
113
-
114
-
115
-
116
-
117
-
118
-
119
-
120
-
121
-
122
-
123
-
124
-
125
-
126
-
127
-
128
-
129
-
130
-
131
-
132
-
133
-
134
-
135
-
136
-
137
-
138
-
139
-
140
-
141
-
142
-
143
 |
 |

43
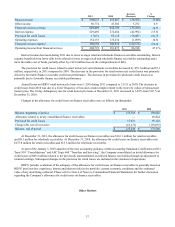
The decrease in operating cash flow in 2012 compared to 2011 was due primarily to working capital changes which
resulted in lower operating cash inflows in 2012 as compared to 2011. This was due in part to the recognition of a prepaid
income tax balance at the end of 2012 driven by accelerated depreciation deductions as well as the timing of quarterly earnings
and related estimated tax payments during 2012. Additionally, the Company made voluntary contributions to its qualified
pension plans totaling $200 million in both 2012 and 2011, impacting operating cash flow in both years.
The decrease in operating cash flow for 2011 compared to 2010 was due primarily to the $200.0 million voluntary
contribution to the Company’s qualified pension plan in 2011 and higher cash outflows related to an increase in wholesale
finance receivables originations in 2011. In addition, working capital changes resulted in lower operating cash inflows in 2011
as compared to 2010. The working capital changes were driven by increases in inventory that were the result of a management
decision to increase finished goods motorcycle inventories at the end of 2011 in preparation for the 2012 ERP implementation
that was completed at the York facility.
Investing Activities
The Company’s investing activities consist primarily of capital expenditures, net changes in retail finance receivables and
short-term investment activity. Capital expenditures were $189.0 million, $189.0 million and $170.8 million during 2012, 2011
and 2010, respectively.
Net cash flows from finance receivables, which consisted primarily of retail finance receivables, for 2012 were $228.7
million lower than 2011 as a result of an increase in retail motorcycle loan originations during 2012. Net cash flows from
finance receivables, which consisted primarily of retail finance receivables, for 2011 were $278.4 million lower than in 2010 as
a result of an increase in retail motorcycle loan originations during 2011.
Changes in the Company’s investment in marketable securities resulted in cash inflows of $18.3 million in 2012 and cash
outflows of $12.5 million and $100.1 million in 2011 and 2010, respectively.
Financing Activities
The Company’s financing activities consist primarily of dividend payments, share repurchases and debt activity.
The Company paid dividends of $0.62 per share totaling $141.7 million during 2012, $0.475 per share totaling $111.0
million during 2011 and $0.40 per share totaling $94.1 million in 2010.
Cash outflows from share repurchases were $311.6 million, $224.5 million and $1.7 million for 2012, 2011 and 2010,
respectively. Share repurchases during 2012 and 2011 included 6.7 million and 6.2 million shares of common stock,
respectively, related to discretionary share repurchases and shares of common stock that employees surrendered to satisfy
withholding taxes in connection with the vesting of restricted stock awards. Share repurchases in 2010 were limited to shares of
common stock that employees surrendered to satisfy withholding taxes in connection with the vesting of restricted stock
awards. As of December 31, 2012, 14.5 million shares remained on a board-approved share repurchase authorization. As of
December 31, 2012, there were no shares available on a separate board-approved share repurchase authorization that is in place
to offset option exercises and restricted stock grants.
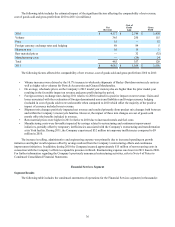
The Company’s total outstanding debt consisted of the following as of December 31, 2012, 2011 and 2010 (in
thousands):
2012 2011 2010
Global credit facilities $ — $ 159,794 $ 213,772
Unsecured commercial paper 294,943 874,286 582,572
Asset-backed Canadian commercial paper conduit facility 175,658 — —
Medium-term notes 2,881,272 2,298,193 1,897,778
Senior unsecured notes 303,000 303,000 303,000
Term asset-backed securitization debt 1,447,776 2,087,346 2,755,234
Total debt $ 5,102,649 $ 5,722,619 $ 5,752,356
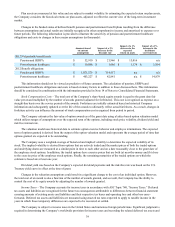
In order to access the debt capital markets, the Company relies on credit rating agencies to assign short-term and long-
term credit ratings. Generally, lower credit ratings result in higher borrowing costs and reduced access to debt capital markets.