Harley Davidson 2012 Annual Report Download - page 97
Download and view the complete annual report
Please find page 97 of the 2012 Harley Davidson annual report below. You can navigate through the pages in the report by either clicking on the pages listed below, or by using the keyword search tool below to find specific information within the annual report.-
 1
1 -
2
-
3
-
4
-
5
-
6
-
7
-
8
-
9
-
10
-
11
-
12
-
13
-
14
-
15
-
16
-
17
-
18
-
19
-
20
-
21
-
22
-
23
-
24
-
25
-
26
-
27
-
28
-
29
-
30
-
31
-
32
-
33
-
34
-
35
-
36
-
37
-
38
-
39
-
40
-
41
-
42
-
43
-
44
-
45
-
46
-
47
-
48
-
49
-
50
-
51
-
52
-
53
-
54
-
55
-
56
-
57
-
58
-
59
-
60
-
61
-
62
-
63
-
64
-
65
-
66
-
67
-
68
-
69
-
70
-
71
-
72
-
73
-
74
-
75
-
76
-
77
-
78
-
79
-
80
-
81
-
82
-
83
-
84
-
85
-
86
-
 87
87 -
 88
88 -
 89
89 -
 90
90 -
 91
91 -
 92
92 -
 93
93 -
 94
94 -
 95
95 -
 96
96 -
 97
97 -
 98
98 -
 99
99 -
 100
100 -
 101
101 -
 102
102 -
 103
103 -
 104
104 -
 105
105 -
 106
106 -
 107
107 -
108
-
109
-
110
-
111
-
112
-
113
-
114
-
115
-
116
-
117
-
118
-
119
-
120
-
121
-
122
-
123
-
124
-
125
-
126
-
127
-
128
-
129
-
130
-
131
-
132
-
133
-
134
-
135
-
136
-
137
-
138
-
139
-
140
-
141
-
142
-
143
 |
 |

97
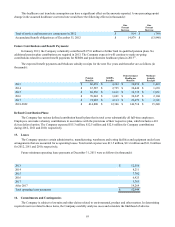
Stock Appreciation Rights (SARs)
SARs vest under the same terms and conditions as options; however, they are settled in cash equal to their settlement date
fair value. As a result, SARs are recorded in the Company’s consolidated balance sheets as a liability until the date of exercise.
The fair value of each SAR award is estimated using a lattice-based valuation model. In accordance with ASC Topic 718,
“Stock Compensation”, the fair value of each SAR award is recalculated at the end of each reporting period and the liability
and expense adjusted based on the new fair value and the percent vested.
The assumptions used to determine the fair value of the SAR awards at December 31, 2012 and 2011 were as follows:
2012 2011
Expected average term (in years) 1.3 - 5.6 2.2 - 6.2
Expected volatility 31% - 45% 40% - 49%
Expected dividend yield 1.3% 1.0%
Risk-free interest rate .1% - 1.8% 0.1% - 2.2%
The following table summarizes the SAR transactions for the year ended December 31, 2012 (in thousands except for per
share amounts):
SARs
Weighted-
Average
Price
Outstanding, beginning of period 273 $ 21
Granted 21 $ 45
Exercised (40) $ 22
Forfeited (1) $ 22
Outstanding, end of period 253 $ 23
Exercisable, end of period 160 $ 22
The weighted-average fair value of SARs granted during the years ended December 31, 2012, 2011 and 2010 was $14,
$15 and $8, respectively.
Restricted (Nonvested) Stock:
The fair value of restricted stock is determined based on the market price of the Company’s shares on the grant date. The
following table summarizes the restricted stock transactions for the year ended December 31, 2012 (in thousands except for per
share amounts):
Restricted
Shares
Grant Date
Fair Value
Per Share
Nonvested, beginning of period 1,941 $ 26
Granted 521 $ 45
Vested (687) $ 32
Forfeited (83) $ 29
Nonvested, end of period 1,692 $ 29
As of December 31, 2012, there was $24.4 million of unrecognized compensation cost related to restricted stock that is
expected to be recognized over a weighted-average period of 1.4 years.
Restricted Stock Units (RSUs)
Restricted stock units vest under the same terms and conditions as restricted stock; however, they are settled in cash equal
to their settlement date fair value. As a result, RSUs are recorded in the Company’s consolidated balance sheets as a liability
until the date of vesting.