Harley Davidson 2012 Annual Report Download - page 54
Download and view the complete annual report
Please find page 54 of the 2012 Harley Davidson annual report below. You can navigate through the pages in the report by either clicking on the pages listed below, or by using the keyword search tool below to find specific information within the annual report.-
 1
1 -
2
-
3
-
4
-
5
-
6
-
7
-
8
-
9
-
10
-
11
-
12
-
13
-
14
-
15
-
16
-
17
-
18
-
19
-
20
-
21
-
22
-
23
-
24
-
25
-
26
-
27
-
28
-
29
-
30
-
31
-
32
-
33
-
34
-
35
-
36
-
37
-
38
-
39
-
40
-
41
-
42
-
43
-
 44
44 -
 45
45 -
 46
46 -
 47
47 -
 48
48 -
 49
49 -
 50
50 -
 51
51 -
 52
52 -
 53
53 -
 54
54 -
 55
55 -
 56
56 -
 57
57 -
 58
58 -
 59
59 -
 60
60 -
 61
61 -
 62
62 -
 63
63 -
 64
64 -
65
-
66
-
67
-
68
-
69
-
70
-
71
-
72
-
73
-
74
-
75
-
76
-
77
-
78
-
79
-
80
-
81
-
82
-
83
-
84
-
85
-
86
-
87
-
88
-
89
-
90
-
91
-
92
-
93
-
94
-
95
-
96
-
97
-
98
-
99
-
100
-
101
-
102
-
103
-
104
-
105
-
106
-
107
-
108
-
109
-
110
-
111
-
112
-
113
-
114
-
115
-
116
-
117
-
118
-
119
-
120
-
121
-
122
-
123
-
124
-
125
-
126
-
127
-
128
-
129
-
130
-
131
-
132
-
133
-
134
-
135
-
136
-
137
-
138
-
139
-
140
-
141
-
142
-
143
 |
 |

54
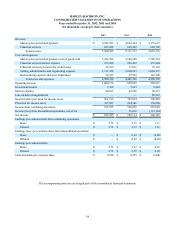
HARLEY-DAVIDSON, INC.
CONSOLIDATED STATEMENTS OF OPERATIONS
Years ended December 31, 2012, 2011 and 2010
(In thousands, except per share amounts)
2012 2011 2010
Revenue:
Motorcycles and related products $ 4,942,582 $ 4,662,264 $ 4,176,627
Financial services 637,924 649,449 682,709
Total revenue 5,580,506 5,311,713 4,859,336
Costs and expenses:
Motorcycles and related products cost of goods sold 3,222,394 3,106,288 2,749,224
Financial services interest expense 195,990 229,492 272,484
Financial services provision for credit losses 22,239 17,031 93,118
Selling, administrative and engineering expense 1,111,232 1,060,943 1,020,371
Restructuring expense and asset impairment 28,475 67,992 163,508
Total costs and expenses 4,580,330 4,481,746 4,298,705
Operating income 1,000,176 829,967 560,631
Investment income 7,369 7,963 5,442
Interest expense 46,033 45,266 90,357
Loss on debt extinguishment — — 85,247
Income before provision for income taxes 961,512 792,664 390,469
Provision for income taxes 337,587 244,586 130,800
Income from continuing operations 623,925 548,078 259,669
Income (loss) from discontinued operations, net of tax — 51,036 (113,124)
Net income $ 623,925 $ 599,114 $ 146,545
Earnings per common share from continuing operations:
Basic $ 2.75 $ 2.35 $ 1.11
Diluted $ 2.72 $ 2.33 $ 1.11
Earnings (loss) per common share from discontinued operations:
Basic $ — $ 0.22 $ (0.48)
Diluted $ — $ 0.22 $ (0.48)
Earnings per common share:
Basic $ 2.75 $ 2.57 $ 0.63
Diluted $ 2.72 $ 2.55 $ 0.62
Cash dividends per common share $ 0.620 $ 0.475 $ 0.400
The accompanying notes are an integral part of the consolidated financial statements.