Harley Davidson 2012 Annual Report Download - page 106
Download and view the complete annual report
Please find page 106 of the 2012 Harley Davidson annual report below. You can navigate through the pages in the report by either clicking on the pages listed below, or by using the keyword search tool below to find specific information within the annual report.-
 1
1 -
2
-
3
-
4
-
5
-
6
-
7
-
8
-
9
-
10
-
11
-
12
-
13
-
14
-
15
-
16
-
17
-
18
-
19
-
20
-
21
-
22
-
23
-
24
-
25
-
26
-
27
-
28
-
29
-
30
-
31
-
32
-
33
-
34
-
35
-
36
-
37
-
38
-
39
-
40
-
41
-
42
-
43
-
44
-
45
-
46
-
47
-
48
-
49
-
50
-
51
-
52
-
53
-
54
-
55
-
56
-
57
-
58
-
59
-
60
-
61
-
62
-
63
-
64
-
65
-
66
-
67
-
68
-
69
-
70
-
71
-
72
-
73
-
74
-
75
-
76
-
77
-
78
-
79
-
80
-
81
-
82
-
83
-
84
-
85
-
86
-
87
-
88
-
89
-
90
-
91
-
92
-
93
-
94
-
95
-
 96
96 -
 97
97 -
 98
98 -
 99
99 -
 100
100 -
 101
101 -
 102
102 -
 103
103 -
 104
104 -
 105
105 -
 106
106 -
 107
107 -
 108
108 -
 109
109 -
 110
110 -
 111
111 -
 112
112 -
 113
113 -
 114
114 -
 115
115 -
 116
116 -
117
-
118
-
119
-
120
-
121
-
122
-
123
-
124
-
125
-
126
-
127
-
128
-
129
-
130
-
131
-
132
-
133
-
134
-
135
-
136
-
137
-
138
-
139
-
140
-
141
-
142
-
143
 |
 |

106
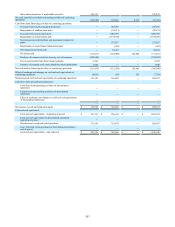
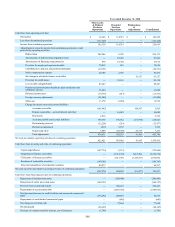
Net cash used by financing activities of continuing operations (794,275) (420,798) 225,000 (990,073)
Effect of exchange rate changes on cash and cash equivalents of continuing
operations (7,714) (1,172) — (8,886)
Net (decrease) increase in cash and cash equivalents of continuing operations (215,614) (243,198) — (458,812)
Cash flows from discontinued operations:
Cash flows from operating activities of discontinued operations ————
Cash flows from investing activities of discontinued operations ————
Effect of exchange rate changes on cash and cash equivalents of
discontinued operations — — — —
————
Net (decrease) increase in cash and cash equivalents $ (215,614) $ (243,198) $ — $ (458,812)
Cash and cash equivalents:
Cash and cash equivalents—beginning of period $ 943,330 $ 583,620 $ — $ 1,526,950
Cash and cash equivalents of discontinued operations—beginning of
period ————
Net (decrease) increase in cash and cash equivalents (215,614) (243,198) — (458,812)
Less: Cash and cash equivalents of discontinued operations—end of
period ————
Cash and cash equivalents—end of period $ 727,716 $ 340,422 $ — $ 1,068,138
Year Ended December 31, 2011
Motorcycles
& Related
Products
Operations
Financial
Services
Operations
Eliminations
&
Adjustments Consolidated
Cash flows from operating activities:
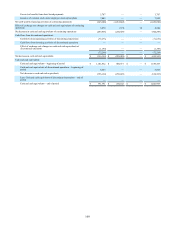
Net income $ 558,807 $ 165,307 $ (125,000) $ 599,114
Income from discontinued operations 51,036 — — 51,036
Income from continuing operations 507,771 165,307 (125,000) 548,078
Adjustments to reconcile income from continuing operations
to cash provided by operating activities:
Depreciation 173,959 6,449 — 180,408
Amortization of deferred loan origination costs — 78,695 — 78,695
Amortization of financing origination fees 473 10,317 — 10,790
Provision for employee long-term benefits 55,942 3,499 — 59,441
Contributions to pension and postretirement plans (219,695) — — (219,695)
Stock compensation expense 35,404 2,788 — 38,192
Net change in wholesale finance receivables — — (2,335) (2,335)
Provision for credit losses — 17,031 — 17,031
Loss on debt extinguishment — 9,608 — 9,608
Pension and postretirement healthcare plan curtailment
and settlement expense 236 — — 236
Deferred income taxes 71,555 16,318 — 87,873
Foreign currency adjustments 10,678 — — 10,678
Other, net (16,650) 843 — (15,807)
Change in current assets and current liabilities:
Accounts receivable 60,403 — (17,353) 43,050
Finance receivables – accrued interest and other — 5,027 — 5,027
Inventories (94,957) — — (94,957)
Accounts payable and accrued liabilities 81,670 (25,989) 64,610 120,291
Restructuring reserves 8,072 — — 8,072
Derivative instruments (2,519) 31 — (2,488)
Prepaid and other 1,154 49,524 (47,575) 3,103
Total adjustments 165,725 174,141 (2,653) 337,213
Net cash provided by operating activities of continuing operations 673,496 339,448 (127,653) 885,291
Cash flows from investing activities of continuing operations:
Capital expenditures (179,988) (9,047) — (189,035)
Origination of finance receivables — (6,056,242) 3,434,218 (2,622,024)
Collections of finance receivables — 6,191,932 (3,431,883) 2,760,049
Purchases of marketable securities (142,653) — — (142,653)