Harley Davidson 2012 Annual Report Download - page 28
Download and view the complete annual report
Please find page 28 of the 2012 Harley Davidson annual report below. You can navigate through the pages in the report by either clicking on the pages listed below, or by using the keyword search tool below to find specific information within the annual report.-
 1
1 -
2
-
3
-
4
-
5
-
6
-
7
-
8
-
9
-
10
-
11
-
12
-
13
-
14
-
15
-
16
-
17
-
 18
18 -
 19
19 -
 20
20 -
 21
21 -
 22
22 -
 23
23 -
 24
24 -
 25
25 -
 26
26 -
 27
27 -
 28
28 -
 29
29 -
 30
30 -
 31
31 -
 32
32 -
 33
33 -
 34
34 -
 35
35 -
 36
36 -
 37
37 -
 38
38 -
39
-
40
-
41
-
42
-
43
-
44
-
45
-
46
-
47
-
48
-
49
-
50
-
51
-
52
-
53
-
54
-
55
-
56
-
57
-
58
-
59
-
60
-
61
-
62
-
63
-
64
-
65
-
66
-
67
-
68
-
69
-
70
-
71
-
72
-
73
-
74
-
75
-
76
-
77
-
78
-
79
-
80
-
81
-
82
-
83
-
84
-
85
-
86
-
87
-
88
-
89
-
90
-
91
-
92
-
93
-
94
-
95
-
96
-
97
-
98
-
99
-
100
-
101
-
102
-
103
-
104
-
105
-
106
-
107
-
108
-
109
-
110
-
111
-
112
-
113
-
114
-
115
-
116
-
117
-
118
-
119
-
120
-
121
-
122
-
123
-
124
-
125
-
126
-
127
-
128
-
129
-
130
-
131
-
132
-
133
-
134
-
135
-
136
-
137
-
138
-
139
-
140
-
141
-
142
-
143
 |
 |

28
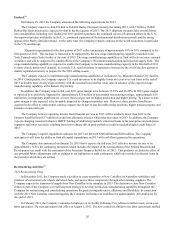
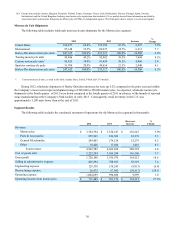
Results of Operations 2012 Compared to 2011
Consolidated Results
(in thousands, except earnings per share) 2012 2011 Increase
(Decrease) %
Change
Operating income from motorcycles & related products $ 715,489 $ 561,176 $ 154,313 27.5 %
Operating income from financial services 284,687 268,791 15,896 5.9 %
Operating income 1,000,176 829,967 170,209 20.5 %
Investment income 7,369 7,963 (594) (7.5)%
Interest expense 46,033 45,266 767 1.7 %
Income before income taxes 961,512 792,664 168,848 21.3 %
Provision for income taxes 337,587 244,586 93,001 38.0 %
Income from continuing operations 623,925 548,078 75,847 13.8 %
Income from discontinued operations, net of taxes — 51,036 (51,036) NM
Net income $ 623,925 $ 599,114 $ 24,811 4.1 %
Diluted earnings per share from continuing operations $ 2.72 $ 2.33 $ 0.39 16.7 %
Diluted earnings per share from discontinued operations $ — $ 0.22 $ (0.22) NM
Diluted earnings per share $ 2.72 $ 2.55 $ 0.17 6.7 %
Operating income for the Motorcycles segment during 2012 improved by $154.3 million compared to 2011 driven by a
6.2% increase in motorcycle shipments, price increases, decreases in manufacturing costs and lower restructuring expenses
compared to the prior year. Operating income for the Financial Services segment improved by $15.9 million during 2012
primarily due to lower interest expense. Please refer to the “Motorcycles and Related Products Segment” and “Financial
Services Segment” discussions following for a more detailed discussion of the factors affecting operating income.
The effective income tax rate for 2012 was 35.1% compared to 30.9% for 2011. The lower 2011 effective tax rate was
mainly driven by a change in the 2011 Wisconsin income tax law associated with certain net operating losses, the favorable
settlement of an IRS audit and the impact of the federal Research and Development Tax Credit.
In 2011, the Company recognized a $51.0 million benefit on income from discontinued operations, driven by the reversal
of tax amounts reserved in prior years related to the divestiture of the Company’s MV Agusta subsidiaries. The amounts had
been reserved pending an agreement that the Company and the IRS reached on the tax treatment of the transaction in December
2011.
Diluted earnings per share from continuing operations was $2.72 in 2012, up 16.7% over 2011. The increase in
diluted earnings per share was driven primarily by the 13.8% increase in income from continuing operations, but also benefited
from lower diluted weighted average shares outstanding. Diluted weighted average share outstanding decreased from 234.9
million in 2011 to 229.2 million in 2012 driven by the Company's repurchase of common stock over the last two years. Please
refer to "Liquidity and Capital Resources" for additional information concerning the Company's share repurchase activity.