Harley Davidson 2012 Annual Report Download - page 88
Download and view the complete annual report
Please find page 88 of the 2012 Harley Davidson annual report below. You can navigate through the pages in the report by either clicking on the pages listed below, or by using the keyword search tool below to find specific information within the annual report.-
 1
1 -
2
-
3
-
4
-
5
-
6
-
7
-
8
-
9
-
10
-
11
-
12
-
13
-
14
-
15
-
16
-
17
-
18
-
19
-
20
-
21
-
22
-
23
-
24
-
25
-
26
-
27
-
28
-
29
-
30
-
31
-
32
-
33
-
34
-
35
-
36
-
37
-
38
-
39
-
40
-
41
-
42
-
43
-
44
-
45
-
46
-
47
-
48
-
49
-
50
-
51
-
52
-
53
-
54
-
55
-
56
-
57
-
58
-
59
-
60
-
61
-
62
-
63
-
64
-
65
-
66
-
67
-
68
-
69
-
70
-
71
-
72
-
73
-
74
-
75
-
76
-
77
-
 78
78 -
 79
79 -
 80
80 -
 81
81 -
 82
82 -
 83
83 -
 84
84 -
 85
85 -
 86
86 -
 87
87 -
 88
88 -
 89
89 -
 90
90 -
 91
91 -
 92
92 -
 93
93 -
 94
94 -
 95
95 -
 96
96 -
 97
97 -
 98
98 -
99
-
100
-
101
-
102
-
103
-
104
-
105
-
106
-
107
-
108
-
109
-
110
-
111
-
112
-
113
-
114
-
115
-
116
-
117
-
118
-
119
-
120
-
121
-
122
-
123
-
124
-
125
-
126
-
127
-
128
-
129
-
130
-
131
-
132
-
133
-
134
-
135
-
136
-
137
-
138
-
139
-
140
-
141
-
142
-
143
 |
 |

88
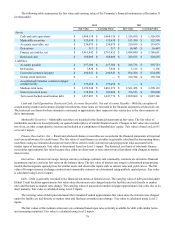
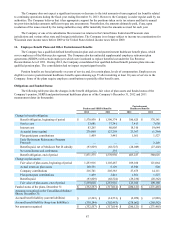
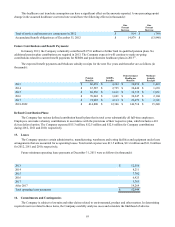
Benefit Costs:
Components of net periodic benefit costs for the years ended December 31 (in thousands):
Pension and
SERPA Benefits Postretirement
Healthcare Benefits
2012 2011 2010 2012 2011 2010
Service cost $ 33,681 $ 37,341 $ 42,889 $ 7,413 $ 7,630 $ 9,957
Interest cost 83,265 80,805 77,996 18,310 19,644 20,774
Expected return on plan assets (117,110) (106,612)(97,376)(9,423)(9,386)(9,781)
Amortization of unrecognized:
Prior service cost (credit) 2,958 2,981 4,383 (3,853)(3,878)(2,914)
Net loss 43,874 30,266 23,872 7,421 7,192 9,394
Net curtailment loss — 236 15,508 — — 11,643
Settlement loss 6,242 274 4,673 — — —
Net periodic benefit cost $ 52,910 $ 45,291 $ 71,945 $ 19,868 $ 21,202 $ 39,073
The 2010 Restructuring Plan actions discussed in Note 5 resulted in the pension and postretirement healthcare plan net
curtailment losses noted in the table above and were included in restructuring expense in the consolidated income statement.
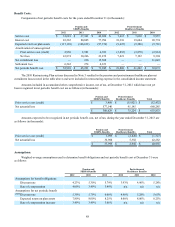
Amounts included in accumulated other comprehensive income, net of tax, at December 31, 2012 which have not yet
been recognized in net periodic benefit cost are as follows (in thousands):
Pension and
SERPA Benefits Postretirement
Healthcare Benefits Total
Prior service cost (credit) $ 3,489 $ (15,921) $ (12,432)
Net actuarial loss 577,140 91,145 668,285
$ 580,629 $ 75,224 $ 655,853
Amounts expected to be recognized in net periodic benefit cost, net of tax, during the year ended December 31, 2013 are
as follows (in thousands):
Pension and
SERPA Benefits Postretirement
Healthcare Benefits Total
Prior service cost (credit) $ 1,099 $ (2,426) $ (1,327)
Net actuarial loss 36,900 5,382 42,282
$ 37,999 $ 2,956 $ 40,955
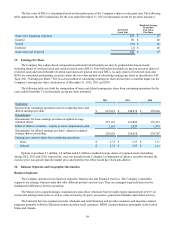
Assumptions:
Weighted-average assumptions used to determine benefit obligations and net periodic benefit cost at December 31 were
as follows:
Pension and
SERPA Benefits Postretirement
Healthcare Benefits
2012 2011 2010 2012 2011 2010
Assumptions for benefit obligations:
Discount rate 4.23% 5.30% 5.79% 3.93% 4.90% 5.28%
Rate of compensation 4.00% 3.49% 3.49% n/a n/a n/a
Assumptions for net periodic benefit
cost:Discount rate 5.30% 5.79% 6.00% 4.90% 5.28% 5.65%
Expected return on plan assets 7.80% 8.00% 8.25% 8.00% 8.00% 8.25%
Rate of compensation increase 3.49% 3.49% 3.66% n/a n/a n/a