Harley Davidson 2012 Annual Report Download - page 79
Download and view the complete annual report
Please find page 79 of the 2012 Harley Davidson annual report below. You can navigate through the pages in the report by either clicking on the pages listed below, or by using the keyword search tool below to find specific information within the annual report.-
 1
1 -
2
-
3
-
4
-
5
-
6
-
7
-
8
-
9
-
10
-
11
-
12
-
13
-
14
-
15
-
16
-
17
-
18
-
19
-
20
-
21
-
22
-
23
-
24
-
25
-
26
-
27
-
28
-
29
-
30
-
31
-
32
-
33
-
34
-
35
-
36
-
37
-
38
-
39
-
40
-
41
-
42
-
43
-
44
-
45
-
46
-
47
-
48
-
49
-
50
-
51
-
52
-
53
-
54
-
55
-
56
-
57
-
58
-
59
-
60
-
61
-
62
-
63
-
64
-
65
-
66
-
67
-
68
-
 69
69 -
 70
70 -
 71
71 -
 72
72 -
 73
73 -
 74
74 -
 75
75 -
 76
76 -
 77
77 -
 78
78 -
 79
79 -
 80
80 -
 81
81 -
 82
82 -
 83
83 -
 84
84 -
 85
85 -
 86
86 -
 87
87 -
 88
88 -
 89
89 -
90
-
91
-
92
-
93
-
94
-
95
-
96
-
97
-
98
-
99
-
100
-
101
-
102
-
103
-
104
-
105
-
106
-
107
-
108
-
109
-
110
-
111
-
112
-
113
-
114
-
115
-
116
-
117
-
118
-
119
-
120
-
121
-
122
-
123
-
124
-
125
-
126
-
127
-
128
-
129
-
130
-
131
-
132
-
133
-
134
-
135
-
136
-
137
-
138
-
139
-
140
-
141
-
142
-
143
 |
 |

79
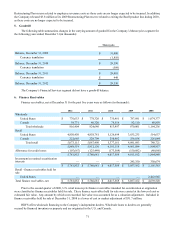
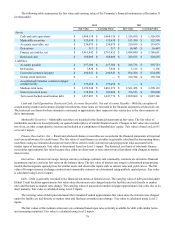
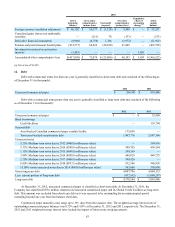
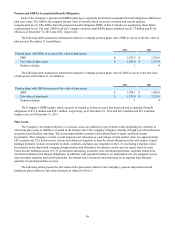
The following table summarizes the fair value and carrying value of the Company’s financial instruments at December 31
(in thousands):
2012 2011
Fair Value Carrying Value Fair Value Carrying Value
Assets:
Cash and cash equivalents $ 1,068,138 $ 1,068,138 $ 1,526,950 $ 1,526,950
Marketable securities $ 135,634 $ 135,634 $ 153,380 $ 153,380
Accounts receivable, net $ 230,079 $ 230,079 $ 219,039 $ 219,039
Derivatives $ 317 $ 317 $ 16,443 $ 16,443
Finance receivables, net $ 5,861,442 $ 5,781,852 $ 5,888,040 $ 5,786,681
Restricted cash $ 188,008 $ 188,008 $ 229,655 $ 229,655
Liabilities:
Accounts payable $ 257,386 $ 257,386 $ 255,713 $ 255,713
Derivatives $ 7,920 $ 7,920 $ 5,136 $ 5,136
Unsecured commercial paper $ 294,943 $ 294,943 $ 874,286 $ 874,286
Global credit facilities $ — $ — $ 159,794 $ 159,794
Asset-backed Canadian commercial paper
conduit facility $ 175,658 $ 175,658 $ — $ —
Medium-term notes $ 3,199,548 $ 2,881,272 $ 2,561,458 $ 2,298,193
Senior unsecured notes $ 338,594 $ 303,000 $ 376,513 $ 303,000
Term asset-backed securitization debt $ 1,457,807 $ 1,447,776 $ 2,099,060 $ 2,087,346
Cash and Cash Equivalents, Restricted Cash, Accounts Receivable, Net and Accounts Payable – With the exception of
certain money-market and commercial paper investments, these items are recorded in the financial statements at historical cost.
The historical cost basis for these amounts is estimated to approximate their respective fair values due to the short maturity of
these instruments.
Marketable Securities – Marketable securities are recorded in the financial statements at fair value. The fair value of
marketable securities is based primarily on quoted market prices of similar financial assets. Changes in fair value are recorded,
net of tax, as other comprehensive income and included as a component of shareholders’ equity. Fair value is based on Level 1
or Level 2 inputs.
Finance Receivables, Net – Retail and wholesale finance receivables are recorded in the financial statements at historical
cost less an allowance for credit losses. The fair value of retail finance receivables is generally calculated by discounting future
cash flows using an estimated discount rate that reflects current credit, interest rate and prepayment risks associated with
similar types of instruments. Fair value is determined based on Level 3 inputs. The historical cost basis of wholesale finance
receivables approximates fair value because they either are short-term or have interest rates that adjust with changes in market
interest rates.
Derivatives – Interest rate swaps, foreign currency exchange contracts and commodity contracts are derivative financial
instruments and are carried at fair value on the balance sheet. The fair value of interest rate swaps is determined using pricing
models that incorporate quoted prices for similar assets and observable inputs such as interest rates and yield curves. The fair
value of foreign currency exchange contracts and commodity contracts are determined using publicly quoted prices. Fair value
is calculated using Level 2 inputs.
Debt – Debt is generally recorded in the financial statements at historical cost. The carrying value of debt provided under
Global Credit Facilities approximates fair value since the interest rates charged under the facilities are tied directly to market
rates and fluctuate as market rates change. The carrying value of unsecured commercial paper approximates fair value due to its
short maturity. Fair value is calculated using Level 2 inputs.
The carrying value of debt provided under the Canadian Conduit approximates fair value since the interest rates charged
under the facility are tied directly to market rates and fluctuate as market rates change. Fair value is calculated using Level 2
inputs.
The fair values of the medium-term notes are estimated based upon rates currently available for debt with similar terms
and remaining maturities. Fair value is calculated using level 2 inputs.