Harley Davidson 2012 Annual Report Download - page 78
Download and view the complete annual report
Please find page 78 of the 2012 Harley Davidson annual report below. You can navigate through the pages in the report by either clicking on the pages listed below, or by using the keyword search tool below to find specific information within the annual report.-
 1
1 -
2
-
3
-
4
-
5
-
6
-
7
-
8
-
9
-
10
-
11
-
12
-
13
-
14
-
15
-
16
-
17
-
18
-
19
-
20
-
21
-
22
-
23
-
24
-
25
-
26
-
27
-
28
-
29
-
30
-
31
-
32
-
33
-
34
-
35
-
36
-
37
-
38
-
39
-
40
-
41
-
42
-
43
-
44
-
45
-
46
-
47
-
48
-
49
-
50
-
51
-
52
-
53
-
54
-
55
-
56
-
57
-
58
-
59
-
60
-
61
-
62
-
63
-
64
-
65
-
66
-
67
-
 68
68 -
 69
69 -
 70
70 -
 71
71 -
 72
72 -
 73
73 -
 74
74 -
 75
75 -
 76
76 -
 77
77 -
 78
78 -
 79
79 -
 80
80 -
 81
81 -
 82
82 -
 83
83 -
 84
84 -
 85
85 -
 86
86 -
 87
87 -
 88
88 -
89
-
90
-
91
-
92
-
93
-
94
-
95
-
96
-
97
-
98
-
99
-
100
-
101
-
102
-
103
-
104
-
105
-
106
-
107
-
108
-
109
-
110
-
111
-
112
-
113
-
114
-
115
-
116
-
117
-
118
-
119
-
120
-
121
-
122
-
123
-
124
-
125
-
126
-
127
-
128
-
129
-
130
-
131
-
132
-
133
-
134
-
135
-
136
-
137
-
138
-
139
-
140
-
141
-
142
-
143
 |
 |

78
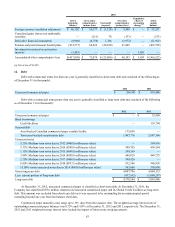
Level 2 inputs include quoted prices for similar assets and observable inputs such as interest rates, foreign currency
exchange rates, commodity rates and yield curves. The Company uses the market approach to derive the fair value for its level
2 fair value measurements. Foreign currency exchange contracts are valued using publicly quoted spot and forward prices;
commodity contracts are valued using publicly quoted prices, where available, or dealer quotes; interest rate swaps are valued
using publicized swap curves; and investments in marketable debt and equity securities are valued using publicly quoted prices.
Level 3 inputs are not observable in the market and include management's judgments about the assumptions market
participants would use in pricing the asset or liability. The use of observable and unobservable inputs is reflected in the
hierarchy assessment disclosed in the following tables.
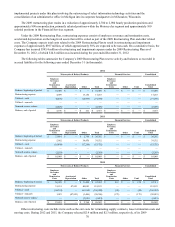
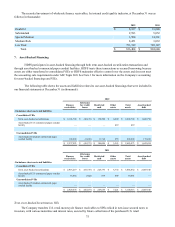
Recurring Fair Value Measurements
The following tables present information about the Company’s assets and liabilities measured at fair value on a recurring
basis as of December 31 (in thousands):
Balance as of
2012
Quoted Prices in
Active Markets for
Identical Assets
(Level 1)
Significant
Other
Observable
Inputs
(Level 2)
Significant
Unobservable
Inputs
(Level 3)
Assets:
Cash equivalents $ 852,979 $ 690,691 $ 162,288 $ —
Marketable securities 135,634 — 135,634 —
Derivatives 317 — 317 —
$ 988,930 $ 690,691 $ 298,239 $ —
Liabilities:
Derivatives $ 7,920 $ — $ 7,920 $ —
Balance as of
2011
Quoted Prices in
Active Markets for
Identical Assets
(Level 1)
Significant
Other
Observable
Inputs
(Level 2)
Significant
Unobservable
Inputs
(Level 3)
Assets:
Cash equivalents $ 1,302,367 $ 1,122,375 $ 179,992 $ —
Marketable securities 153,380 — 153,380 —
Derivatives 16,443 — 16,443 —
$ 1,472,190 $ 1,122,375 $ 349,815 $ —
Liabilities:
Derivatives $ 5,136 $ — $ 5,136 $ —
The hierarchy classification for cash equivalents, in 2011, totaling $180 million has been revised from level 1 to level 2.
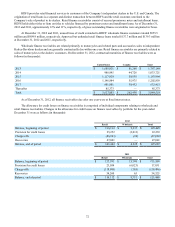
9. Fair Value of Financial Instruments
The Company’s financial instruments consist primarily of cash and cash equivalents, marketable securities, trade
receivables, finance receivables, net, trade payables, debt, foreign currency contracts and interest rate swaps (derivative
instruments are discussed further in Note 10). Under U.S. GAAP certain of these items are required to be recorded in the
financial statements at fair value, while others are required to be recorded at historical cost.