Harley Davidson 2012 Annual Report Download - page 101
Download and view the complete annual report
Please find page 101 of the 2012 Harley Davidson annual report below. You can navigate through the pages in the report by either clicking on the pages listed below, or by using the keyword search tool below to find specific information within the annual report.-
 1
1 -
2
-
3
-
4
-
5
-
6
-
7
-
8
-
9
-
10
-
11
-
12
-
13
-
14
-
15
-
16
-
17
-
18
-
19
-
20
-
21
-
22
-
23
-
24
-
25
-
26
-
27
-
28
-
29
-
30
-
31
-
32
-
33
-
34
-
35
-
36
-
37
-
38
-
39
-
40
-
41
-
42
-
43
-
44
-
45
-
46
-
47
-
48
-
49
-
50
-
51
-
52
-
53
-
54
-
55
-
56
-
57
-
58
-
59
-
60
-
61
-
62
-
63
-
64
-
65
-
66
-
67
-
68
-
69
-
70
-
71
-
72
-
73
-
74
-
75
-
76
-
77
-
78
-
79
-
80
-
81
-
82
-
83
-
84
-
85
-
86
-
87
-
88
-
89
-
90
-
 91
91 -
 92
92 -
 93
93 -
 94
94 -
 95
95 -
 96
96 -
 97
97 -
 98
98 -
 99
99 -
 100
100 -
 101
101 -
 102
102 -
 103
103 -
 104
104 -
 105
105 -
 106
106 -
 107
107 -
 108
108 -
 109
109 -
 110
110 -
 111
111 -
112
-
113
-
114
-
115
-
116
-
117
-
118
-
119
-
120
-
121
-
122
-
123
-
124
-
125
-
126
-
127
-
128
-
129
-
130
-
131
-
132
-
133
-
134
-
135
-
136
-
137
-
138
-
139
-
140
-
141
-
142
-
143
 |
 |
101
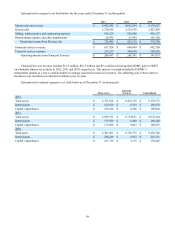
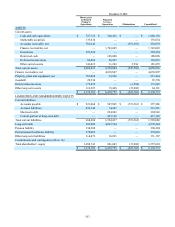
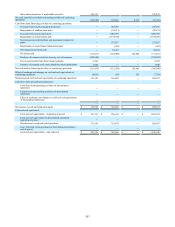
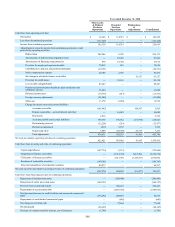
Year Ended December 31, 2012
Motorcycles
& Related
Products
Operations
Financial
Services
Operations Eliminations Consolidated
Revenue:
Motorcycles and related products $ 4,952,748 $ — $ (10,166) $ 4,942,582
Financial services — 639,482 (1,558) 637,924
Total revenue 4,952,748 639,482 (11,724) 5,580,506
Costs and expenses:
Motorcycles and related products cost of goods
sold 3,222,394 — — 3,222,394
Financial services interest expense — 195,990 — 195,990
Financial services provision for credit losses — 22,239 — 22,239
Selling, administrative and engineering expense 977,782 145,174 (11,724) 1,111,232
Restructuring expense 28,475 — — 28,475
Total costs and expenses 4,228,651 363,403 (11,724) 4,580,330
Operating income 724,097 276,079 — 1,000,176
Investment income 232,369 — (225,000) 7,369
Interest expense 46,033 — — 46,033
Income before provision for income taxes 910,433 276,079 (225,000) 961,512
Provision for income taxes 233,385 104,202 — 337,587
Income from continuing operations 677,048 171,877 (225,000) 623,925
Income from discontinued operations, net of tax — — — —
Net income $ 677,048 $ 171,877 $ (225,000) $ 623,925
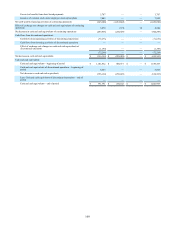
Year Ended December 31, 2011
Motorcycles
& Related
Products
Operations
Financial
Services
Operations Eliminations Consolidated
Revenue:
Motorcycles and related products $ 4,671,942 $ — $ (9,678) $ 4,662,264
Financial services — 649,474 (25) 649,449
Total revenue 4,671,942 649,474 (9,703) 5,311,713
Costs and expenses:
Motorcycles and related products cost of goods
sold 3,106,288 — — 3,106,288
Financial services interest expense — 229,492 — 229,492
Financial services provision for credit losses — 17,031 — 17,031
Selling, administrative and engineering expense 926,832 143,814 (9,703) 1,060,943
Restructuring expense 67,992 — — 67,992
Total costs and expenses 4,101,112 390,337 (9,703) 4,481,746
Operating income 570,830 259,137 — 829,967
Investment income 132,963 — (125,000) 7,963
Interest expense 45,266 — — 45,266
Income before provision for income taxes 658,527 259,137 (125,000) 792,664
Provision for income taxes 150,756 93,830 — 244,586
Income from continuing operations 507,771 165,307 (125,000) 548,078
Income from discontinued operations, net of tax 51,036 — — 51,036
Net income $ 558,807 $ 165,307 $ (125,000) $ 599,114