Harley Davidson 2012 Annual Report Download - page 66
Download and view the complete annual report
Please find page 66 of the 2012 Harley Davidson annual report below. You can navigate through the pages in the report by either clicking on the pages listed below, or by using the keyword search tool below to find specific information within the annual report.-
 1
1 -
2
-
3
-
4
-
5
-
6
-
7
-
8
-
9
-
10
-
11
-
12
-
13
-
14
-
15
-
16
-
17
-
18
-
19
-
20
-
21
-
22
-
23
-
24
-
25
-
26
-
27
-
28
-
29
-
30
-
31
-
32
-
33
-
34
-
35
-
36
-
37
-
38
-
39
-
40
-
41
-
42
-
43
-
44
-
45
-
46
-
47
-
48
-
49
-
50
-
51
-
52
-
53
-
54
-
55
-
 56
56 -
 57
57 -
 58
58 -
 59
59 -
 60
60 -
 61
61 -
 62
62 -
 63
63 -
 64
64 -
 65
65 -
 66
66 -
 67
67 -
 68
68 -
 69
69 -
 70
70 -
 71
71 -
 72
72 -
 73
73 -
 74
74 -
 75
75 -
 76
76 -
77
-
78
-
79
-
80
-
81
-
82
-
83
-
84
-
85
-
86
-
87
-
88
-
89
-
90
-
91
-
92
-
93
-
94
-
95
-
96
-
97
-
98
-
99
-
100
-
101
-
102
-
103
-
104
-
105
-
106
-
107
-
108
-
109
-
110
-
111
-
112
-
113
-
114
-
115
-
116
-
117
-
118
-
119
-
120
-
121
-
122
-
123
-
124
-
125
-
126
-
127
-
128
-
129
-
130
-
131
-
132
-
133
-
134
-
135
-
136
-
137
-
138
-
139
-
140
-
141
-
142
-
143
 |
 |

66
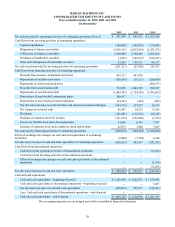
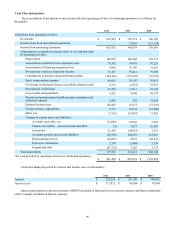
Cash Flow Information:
The reconciliation of net income to net cash provided by operating activities of continuing operations is as follows (in
thousands):
2012 2011 2010
Cash flows from operating activities:
Net income $ 623,925 $ 599,114 $ 146,545
Income (loss) from discontinued operations — 51,036 (113,124)
Income from continuing operations 623,925 548,078 259,669
Adjustments to reconcile net income (loss) to net cash provided
by operating activities:
Depreciation 168,978 180,408 255,171
Amortization of deferred loan origination costs 78,592 78,695 87,223
Amortization of financing origination fees 9,969 10,790 19,618
Provision for employee long-term benefits 71,347 59,441 79,630
Contributions to pension and postretirement plans (244,416)(219,695)(39,391)
Stock compensation expense 40,815 38,192 30,431
Net change in wholesale finance receivables related to sales 2,513 (2,335) 81,527
Provision for credit losses 22,239 17,031 93,118
Loss on debt extinguishment 4,323 9,608 85,247
Pension and postretirement healthcare plan curtailment and
settlement expense 6,242 236 31,824
Deferred income taxes 128,452 87,873 (17,591)
Foreign currency adjustments 9,773 10,678 (21,480)
Other, net (7,216)(15,807) 11,910
Changes in current assets and liabilities:
Accounts receivable, net (13,690) 43,050 2,905
Finance receivables – accrued interest and other (4) 5,027 10,083
Inventories 21,459 (94,957) 2,516
Accounts payable and accrued liabilities (10,798) 120,291 215,013
Restructuring reserves (16,087) 8,072 (32,477)
Derivative instruments 2,758 (2,488) 5,339
Prepaid and other (97,716) 3,103 3,133
Total adjustments 177,533 337,213 903,749
Net cash provided by operating activities of continuing operations $ 801,458 $ 885,291 $ 1,163,418
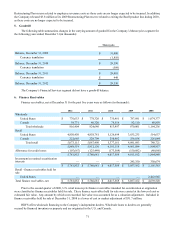
Cash paid during the period for interest and income taxes (in thousands):
2012 2011 2010
Interest $ 225,228 $ 251,341 $ 346,855
Income taxes $ 317,812 $ 84,984 $ 47,084
Interest paid represents interest payments of HDFS (included in financial services interest expense) and interest payments
of the Company (included in interest expense).