Harley Davidson 2012 Annual Report Download - page 109
Download and view the complete annual report
Please find page 109 of the 2012 Harley Davidson annual report below. You can navigate through the pages in the report by either clicking on the pages listed below, or by using the keyword search tool below to find specific information within the annual report.-
 1
1 -
2
-
3
-
4
-
5
-
6
-
7
-
8
-
9
-
10
-
11
-
12
-
13
-
14
-
15
-
16
-
17
-
18
-
19
-
20
-
21
-
22
-
23
-
24
-
25
-
26
-
27
-
28
-
29
-
30
-
31
-
32
-
33
-
34
-
35
-
36
-
37
-
38
-
39
-
40
-
41
-
42
-
43
-
44
-
45
-
46
-
47
-
48
-
49
-
50
-
51
-
52
-
53
-
54
-
55
-
56
-
57
-
58
-
59
-
60
-
61
-
62
-
63
-
64
-
65
-
66
-
67
-
68
-
69
-
70
-
71
-
72
-
73
-
74
-
75
-
76
-
77
-
78
-
79
-
80
-
81
-
82
-
83
-
84
-
85
-
86
-
87
-
88
-
89
-
90
-
91
-
92
-
93
-
94
-
95
-
96
-
97
-
98
-
 99
99 -
 100
100 -
 101
101 -
 102
102 -
 103
103 -
 104
104 -
 105
105 -
 106
106 -
 107
107 -
 108
108 -
 109
109 -
 110
110 -
 111
111 -
 112
112 -
 113
113 -
 114
114 -
 115
115 -
 116
116 -
 117
117 -
 118
118 -
 119
119 -
120
-
121
-
122
-
123
-
124
-
125
-
126
-
127
-
128
-
129
-
130
-
131
-
132
-
133
-
134
-
135
-
136
-
137
-
138
-
139
-
140
-
141
-
142
-
143
 |
 |

109
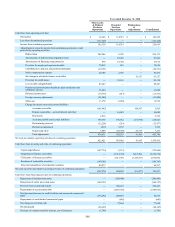
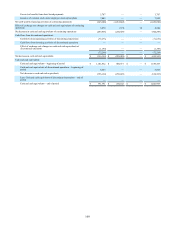
Excess tax benefits from share based payments 3,767 — — 3,767
Issuance of common stock under employee stock option plans 7,845 — — 7,845
Net cash used by financing activities of continuing operations (643,288) (1,212,802) — (1,856,090)
Effect of exchange rate changes on cash and cash equivalents of continuing
operations 5,279 (371) 32 4,940
Net decrease in cash and cash equivalents of continuing operations (283,866) (258,429) — (542,295)
Cash flows from discontinued operations:
Cash flows from operating activities of discontinued operations (71,073) — — (71,073)
Cash flows from investing activities of discontinued operations — — — —
Effect of exchange rate changes on cash and cash equivalents of
discontinued operations (1,195) — — (1,195)
(72,268) — — (72,268)
Net decrease in cash and cash equivalents $ (356,134) $ (258,429) $ — $ (614,563)
Cash and cash equivalents:
Cash and cash equivalents – beginning of period $ 1,141,862 $ 488,571 $ — $ 1,630,433
Cash and cash equivalents of discontinued operations – beginning of
period 6,063 — — 6,063
Net decrease in cash and cash equivalents (356,134) (258,429) — (614,563)
Less: Cash and cash equivalents of discontinued operations – end of
period — — — —
Cash and cash equivalents – end of period $ 791,791 $ 230,142 $ — $ 1,021,933