Harley Davidson 2012 Annual Report Download - page 92
Download and view the complete annual report
Please find page 92 of the 2012 Harley Davidson annual report below. You can navigate through the pages in the report by either clicking on the pages listed below, or by using the keyword search tool below to find specific information within the annual report.-
 1
1 -
2
-
3
-
4
-
5
-
6
-
7
-
8
-
9
-
10
-
11
-
12
-
13
-
14
-
15
-
16
-
17
-
18
-
19
-
20
-
21
-
22
-
23
-
24
-
25
-
26
-
27
-
28
-
29
-
30
-
31
-
32
-
33
-
34
-
35
-
36
-
37
-
38
-
39
-
40
-
41
-
42
-
43
-
44
-
45
-
46
-
47
-
48
-
49
-
50
-
51
-
52
-
53
-
54
-
55
-
56
-
57
-
58
-
59
-
60
-
61
-
62
-
63
-
64
-
65
-
66
-
67
-
68
-
69
-
70
-
71
-
72
-
73
-
74
-
75
-
76
-
77
-
78
-
79
-
80
-
81
-
 82
82 -
 83
83 -
 84
84 -
 85
85 -
 86
86 -
 87
87 -
 88
88 -
 89
89 -
 90
90 -
 91
91 -
 92
92 -
 93
93 -
 94
94 -
 95
95 -
 96
96 -
 97
97 -
 98
98 -
 99
99 -
 100
100 -
 101
101 -
 102
102 -
103
-
104
-
105
-
106
-
107
-
108
-
109
-
110
-
111
-
112
-
113
-
114
-
115
-
116
-
117
-
118
-
119
-
120
-
121
-
122
-
123
-
124
-
125
-
126
-
127
-
128
-
129
-
130
-
131
-
132
-
133
-
134
-
135
-
136
-
137
-
138
-
139
-
140
-
141
-
142
-
143
 |
 |

92
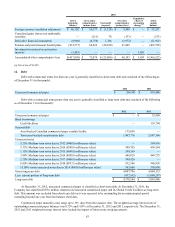
The following table presents a reconciliation of the fair value measurements using significant unobservable inputs (Level
3) as of December 31, 2011 (in thousands):
Total Limited Partnership
Interests Other
Balance, beginning of period $ 42,632 $ 40,421 $ 2,211
Actual return on plan assets:
Relating to assets still held at the reporting date (2,888)(3,018) 130
Purchases, sales and settlements 2,383 2,613 (230)
Balance, end of period $ 42,127 $ 40,016 $ 2,111
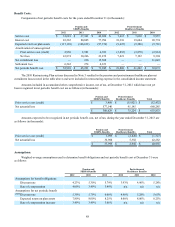
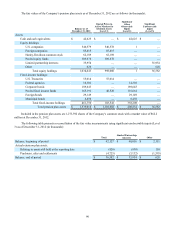
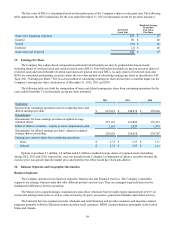
The fair values of the Company’s postretirement healthcare plan assets, which did not contain any Level 3 assets, as of
December 31, 2011, are as follows (in thousands):
Balance as of
December 31, 2011
Quoted Prices in
Active Markets for
Identical Assets
(Level 1)
Significant
Other
Observable
Inputs
(Level 2)
Assets:
Cash and cash equivalents $ 1,858 $ — $ 1,858
Equity holdings:
U.S. companies 79,544 79,091 453
Foreign companies 10,365 10,365 —
Total equity holdings 89,909 89,456 453
Fixed-income holdings:
U.S. Treasuries 7,237 7,237 —
Federal agencies 4,172 — 4,172
Corporate bonds 5,537 — 5,537
Foreign bonds 307 — 307
Municipal bonds 140 — 140
Total fixed-income holdings 17,393 7,237 10,156
Total postretirement healthcare plan assets $ 109,160 $ 96,693 $ 12,467
No plan assets are expected to be returned to the Company during the fiscal year ending December 31, 2013.
For 2013, the Company’s overall expected long-term rate of return on assets is 7.75%. The expected long-term rate of
return is based on the portfolio as a whole and not on the sum of the returns on individual asset categories. The return is based
on historical returns adjusted to reflect the current view of the long-term investment market.
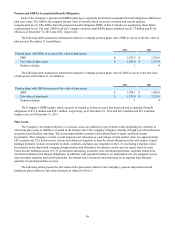
Postretirement Healthcare Cost:
The weighted-average healthcare cost trend rate used in determining the accumulated postretirement benefit obligation of
the healthcare plans was as follows:
2012 2011
Healthcare cost trend rate for next year 7.5% 8.5%
Rate to which the cost trend rate is assumed to decline (the ultimate rate) 5.0% 5.0%
Year that the rate reaches the ultimate trend rate 2019 2019