Harley Davidson 2012 Annual Report Download - page 31
Download and view the complete annual report
Please find page 31 of the 2012 Harley Davidson annual report below. You can navigate through the pages in the report by either clicking on the pages listed below, or by using the keyword search tool below to find specific information within the annual report.-
 1
1 -
2
-
3
-
4
-
5
-
6
-
7
-
8
-
9
-
10
-
11
-
12
-
13
-
14
-
15
-
16
-
17
-
18
-
19
-
20
-
 21
21 -
 22
22 -
 23
23 -
 24
24 -
 25
25 -
 26
26 -
 27
27 -
 28
28 -
 29
29 -
 30
30 -
 31
31 -
 32
32 -
 33
33 -
 34
34 -
 35
35 -
 36
36 -
 37
37 -
 38
38 -
 39
39 -
 40
40 -
 41
41 -
42
-
43
-
44
-
45
-
46
-
47
-
48
-
49
-
50
-
51
-
52
-
53
-
54
-
55
-
56
-
57
-
58
-
59
-
60
-
61
-
62
-
63
-
64
-
65
-
66
-
67
-
68
-
69
-
70
-
71
-
72
-
73
-
74
-
75
-
76
-
77
-
78
-
79
-
80
-
81
-
82
-
83
-
84
-
85
-
86
-
87
-
88
-
89
-
90
-
91
-
92
-
93
-
94
-
95
-
96
-
97
-
98
-
99
-
100
-
101
-
102
-
103
-
104
-
105
-
106
-
107
-
108
-
109
-
110
-
111
-
112
-
113
-
114
-
115
-
116
-
117
-
118
-
119
-
120
-
121
-
122
-
123
-
124
-
125
-
126
-
127
-
128
-
129
-
130
-
131
-
132
-
133
-
134
-
135
-
136
-
137
-
138
-
139
-
140
-
141
-
142
-
143
 |
 |

31
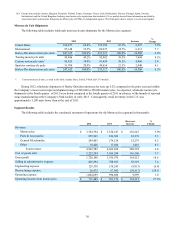
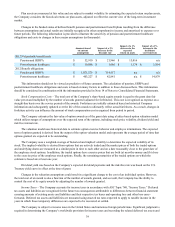
The following table includes the estimated impact of the significant factors affecting the comparability of net revenue,
cost of goods sold and gross profit from 2011 to 2012 (in millions):
Net
Revenue
Cost of
Goods
Sold Gross
Profit
2011 $ 4,662 $ 3,106 $ 1,556
Volume 293 197 96
Price 30 — 30
Foreign currency exchange rates and hedging (76)(59)(17)
Shipment mix 34 29 5
Raw material prices — (7) 7
Manufacturing costs — (43) 43
Total 281 117 164
2012 $ 4,943 $ 3,223 $ 1,720
The following factors affected the comparability of net revenue, cost of goods sold and gross profit from 2011 to 2012:
• Volume increases were driven by the increase in wholesale shipments of motorcycle units as well as higher sales
volumes for Parts & Accessories and General Merchandise.
• On average, wholesale prices on the Company’s 2012 and 2013 model year motorcycles are higher than the preceding
model years resulting in the favorable impact on revenue and gross profit during the period.
• Foreign currency exchange rates during 2012 resulted in a negative impact on net revenue, which was partially offset
by the favorable impact of gains associated with foreign currency hedging included in cost of goods sold.
• Shipment mix changes resulted primarily from favorable product mix changes between motorcycle families.
• Raw material prices were lower in 2012 relative to 2011 primarily due to lower metal costs.
• Manufacturing costs were favorably impacted by savings related to restructuring initiatives. Temporary inefficiencies
associated with the Company’s restructuring and transformation at its York facility were $33 million in 2012 compared
to $32 million in 2011.
The net increase in operating expense was primarily due to incremental investments to support the Company’s growth
initiatives and increases in employee costs including pension. These cost increases were partially offset by lower restructuring
expense related to the Company’s previously announced restructuring activities as well as lower engineering expense. For
further information regarding the Company’s previously announced restructuring activities, refer to Note 4 of Notes to
Condensed Consolidated Financial Statements.
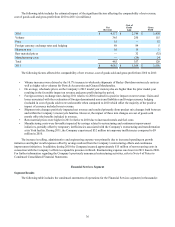
Financial Services Segment
Segment Results
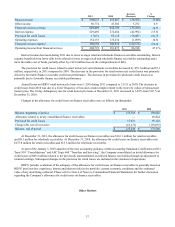
The following table includes the condensed statements of operations for the Financial Services segment (in thousands):
2012 2011 Increase
(Decrease) %
Change
Interest income $ 583,700 $ 598,675 $ (14,975) (2.5)%
Other income 54,224 50,774 3,450 6.8
Financial services revenue 637,924 649,449 (11,525) (1.8)
Interest expense 195,990 229,492 (33,502) (14.6)
Provision for credit losses 22,239 17,031 5,208 30.6
Operating expenses 135,008 134,135 873 0.7
Financial services expense 353,237 380,658 (27,421) (7.2)
Operating income from financial services $ 284,687 $ 268,791 $ 15,896 5.9 %