Delta Airlines 2007 Annual Report Download - page 74
Download and view the complete annual report
Please find page 74 of the 2007 Delta Airlines annual report below. You can navigate through the pages in the report by either clicking on the pages listed below, or by using the keyword search tool below to find specific information within the annual report.-
 1
1 -
2
-
3
-
4
-
5
-
6
-
7
-
8
-
9
-
10
-
11
-
12
-
13
-
14
-
15
-
16
-
17
-
18
-
19
-
20
-
21
-
22
-
23
-
24
-
25
-
26
-
27
-
28
-
29
-
30
-
31
-
32
-
33
-
34
-
35
-
36
-
37
-
38
-
39
-
40
-
41
-
42
-
43
-
44
-
45
-
46
-
47
-
48
-
49
-
50
-
51
-
52
-
53
-
54
-
55
-
56
-
57
-
58
-
59
-
60
-
61
-
62
-
63
-
 64
64 -
 65
65 -
 66
66 -
 67
67 -
 68
68 -
 69
69 -
 70
70 -
 71
71 -
 72
72 -
 73
73 -
 74
74 -
 75
75 -
 76
76 -
 77
77 -
 78
78 -
 79
79 -
 80
80 -
 81
81 -
 82
82 -
 83
83 -
 84
84 -
85
-
86
-
87
-
88
-
89
-
90
-
91
-
92
-
93
-
94
-
95
-
96
-
97
-
98
-
99
-
100
-
101
-
102
-
103
-
104
-
105
-
106
-
107
-
108
-
109
-
110
-
111
-
112
-
113
-
114
-
115
-
116
-
117
-
118
-
119
-
120
-
121
-
122
-
123
-
124
-
125
-
126
-
127
-
128
-
129
-
130
-
131
-
132
-
133
-
134
-
135
-
136
-
137
-
138
-
139
-
140
 |
 |

Table of Contents
Index to Financial Statements
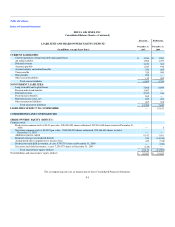
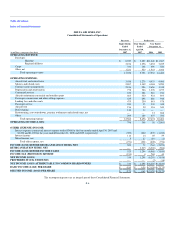
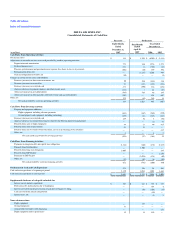
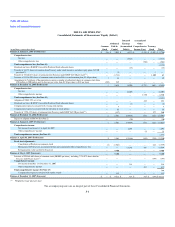
NOTES TO THE CONSOLIDATED FINANCIAL STATEMENTS—(Continued)
companies; (2) a review and analysis of several recent transactions in the airline industry; and (3) a calculation of the present value of future cash flows based
on our projections. Utilizing these methodologies, the reorganization value of the Successor was estimated to be in the range of $9.4 billion and $12.0 billion.
The enterprise value, and corresponding reorganization value, is dependent upon achieving the future financial results set forth in our projections, as well as
the realization of certain other assumptions. There can be no assurance that the projections will be achieved or that the assumptions will be realized. The
excess reorganization value (using the low end of the range) over the fair value of tangible and identifiable intangible assets, net of liabilities, has been
reflected as goodwill in the Fresh Start Consolidated Balance Sheet. The financial projections and estimates of enterprise and reorganization value are not
incorporated herein.
All estimates, assumptions and financial projections, including the fair value adjustments, the financial projections, and the enterprise value and
reorganization value projections, are inherently subject to significant uncertainties and the resolution of contingencies beyond our control. Accordingly, there
can be no assurance that the estimates, assumptions and financial projections will be realized, and actual results could vary materially.
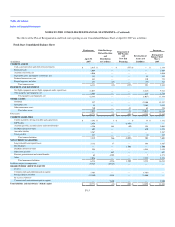
The adjustments set forth in the following Fresh Start Consolidated Balance Sheet in the columns captioned "Debt Discharge, Reclassifications and
Distribution to Creditors," "Repayment of DIP Facility and New Exit Financing" and "Revaluation of Assets and Liabilities" reflect the effect of the
consummation of the transactions contemplated by the Plan of Reorganization, including the settlement of various liabilities, securities issuances, incurrence
of new indebtedness and cash payments.
F-14