Delta Airlines 2007 Annual Report Download - page 68
Download and view the complete annual report
Please find page 68 of the 2007 Delta Airlines annual report below. You can navigate through the pages in the report by either clicking on the pages listed below, or by using the keyword search tool below to find specific information within the annual report.-
 1
1 -
2
-
3
-
4
-
5
-
6
-
7
-
8
-
9
-
10
-
11
-
12
-
13
-
14
-
15
-
16
-
17
-
18
-
19
-
20
-
21
-
22
-
23
-
24
-
25
-
26
-
27
-
28
-
29
-
30
-
31
-
32
-
33
-
34
-
35
-
36
-
37
-
38
-
39
-
40
-
41
-
42
-
43
-
44
-
45
-
46
-
47
-
48
-
49
-
50
-
51
-
52
-
53
-
54
-
55
-
56
-
57
-
 58
58 -
 59
59 -
 60
60 -
 61
61 -
 62
62 -
 63
63 -
 64
64 -
 65
65 -
 66
66 -
 67
67 -
 68
68 -
 69
69 -
 70
70 -
 71
71 -
 72
72 -
 73
73 -
 74
74 -
 75
75 -
 76
76 -
 77
77 -
 78
78 -
79
-
80
-
81
-
82
-
83
-
84
-
85
-
86
-
87
-
88
-
89
-
90
-
91
-
92
-
93
-
94
-
95
-
96
-
97
-
98
-
99
-
100
-
101
-
102
-
103
-
104
-
105
-
106
-
107
-
108
-
109
-
110
-
111
-
112
-
113
-
114
-
115
-
116
-
117
-
118
-
119
-
120
-
121
-
122
-
123
-
124
-
125
-
126
-
127
-
128
-
129
-
130
-
131
-
132
-
133
-
134
-
135
-
136
-
137
-
138
-
139
-
140
 |
 |

Table of Contents
Index to Financial Statements
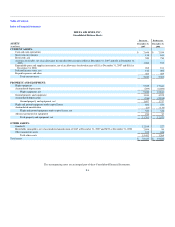
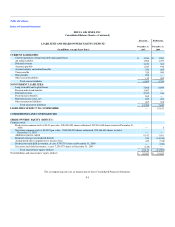
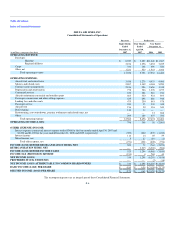
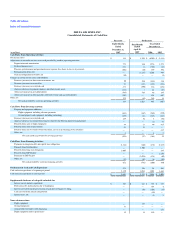
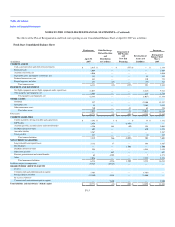
DELTA AIR LINES, INC.
Consolidated Statements of Shareowners' Equity (Deficit)
(in millions, except share data)
Common
Stock
Additional
Paid-In
Capital
Retained
Earnings
(Accumulated
Deficit)
Accumulated
Other
Comprehensive
Income (Loss)
Treasury
Stock Total
Balance at January 1, 2005 (Predecessor) $ 286 $ 3,052 $ (4,373) $ (2,358) $ (2,403) $ (5,796)
Comprehensive loss:
Net loss — — (3,818) — — (3,818)
Other comprehensive loss — — — (364) — (364)
Total comprehensive loss (See Note 13) (4,182)
Dividends on Series B ESOP Convertible Preferred Stock allocated shares — — (18) — — (18)
Transfer of 34,378 shares of common from Treasury under stock incentive and other equity plans ($47.20
per share(1)) — (2) — — 2 —
Transfer of 38,140,673 shares of common from Treasury under ESOP ($47.20 per share(1)) — (1,738) — — 1,800 62
Issuance of 11,336,203 shares of common stock related to Delta's transformation plan ($3.40 per share) 5 34 — — — 39
Amendment to Certificate of Incorporation to increase number of authorized shares of common stock from
450 million to 900 million and to decrease par value from $1.50 per share to $.01 per share (289) 289 — — — —
Balance at December 31, 2005 (Predecessor) 2 1,635 (8,209) (2,722) (601) (9,895)
Comprehensive loss:
Net loss — — (6,203) — — (6,203)
Other comprehensive income — — — 1,780 — 1,780
Total comprehensive loss (See Note 13) (4,423)
Adoption of SFAS 158, net of tax — — — 424 — 424
Dividends on Series B ESOP Convertible Preferred Stock allocated shares — — (2) — — (2)
Compensation expense associated with vesting stock options — 8 — — — 8
Compensation expense associated with the rejection of stock options — 55 — — — 55
Transfer of 7,996,125 shares of common from Treasury under ESOP ($47.20 per share(1)) — (137) — — 377 240
Balance at December 31, 2006 (Predecessor) 2 1,561 (14,414) (518) (224) (13,593)
Impact of adoption of FIN 48 (See Note 2) — — (30) — — (30)
Balance at January 1, 2007 (Predecessor) 2 1,561 (14,444) (518) (224) (13,623)
Comprehensive income:
Net income from January 1 to April 30, 2007 — — 1,298 — — 1,298
Other comprehensive income — — — 75 — 75
Total comprehensive income (See Note 13) 1,373
Balance at April 30, 2007 (Predecessor) 2 1,561 (13,146) (443) (224) (12,250)
Fresh start adjustments:
Cancellation of Predecessor common stock (2) (1,561) — — 224 (1,339)
Elimination of Predecessor accumulated deficit and accumulated other comprehensive loss — — 13,146 443 — 13,589
Reorganization value ascribed to Successor — 9,400 — — — 9,400
Balance at May 1, 2007 (Successor) — 9,400 — — — 9,400
Issuance of 299,464,669 shares of common stock ($0.0001 per share), including 7,238,973 shares held in
Treasury ($20.52 per share)(1) — — — — (148) (148)
Comprehensive income:
Net income from May 1 to December 31, 2007 — — 314 — — 314
Other comprehensive income — — — 435 — 435
Total comprehensive income (See Note 13) 749
Compensation expense associated with equity awards — 112 — — — 112
Balance at December 31, 2007 (Successor) $ — $ 9,512 $ 314 $ 435 $ (148) $ 10,113
(1) Weighted average price per share
The accompanying notes are an integral part of these Consolidated Financial Statements.
F-8