Delta Airlines 2007 Annual Report Download - page 114
Download and view the complete annual report
Please find page 114 of the 2007 Delta Airlines annual report below. You can navigate through the pages in the report by either clicking on the pages listed below, or by using the keyword search tool below to find specific information within the annual report.-
 1
1 -
2
-
3
-
4
-
5
-
6
-
7
-
8
-
9
-
10
-
11
-
12
-
13
-
14
-
15
-
16
-
17
-
18
-
19
-
20
-
21
-
22
-
23
-
24
-
25
-
26
-
27
-
28
-
29
-
30
-
31
-
32
-
33
-
34
-
35
-
36
-
37
-
38
-
39
-
40
-
41
-
42
-
43
-
44
-
45
-
46
-
47
-
48
-
49
-
50
-
51
-
52
-
53
-
54
-
55
-
56
-
57
-
58
-
59
-
60
-
61
-
62
-
63
-
64
-
65
-
66
-
67
-
68
-
69
-
70
-
71
-
72
-
73
-
74
-
75
-
76
-
77
-
78
-
79
-
80
-
81
-
82
-
83
-
84
-
85
-
86
-
87
-
88
-
89
-
90
-
91
-
92
-
93
-
94
-
95
-
96
-
97
-
98
-
99
-
100
-
101
-
102
-
103
-
 104
104 -
 105
105 -
 106
106 -
 107
107 -
 108
108 -
 109
109 -
 110
110 -
 111
111 -
 112
112 -
 113
113 -
 114
114 -
 115
115 -
 116
116 -
 117
117 -
 118
118 -
 119
119 -
 120
120 -
 121
121 -
 122
122 -
 123
123 -
 124
124 -
125
-
126
-
127
-
128
-
129
-
130
-
131
-
132
-
133
-
134
-
135
-
136
-
137
-
138
-
139
-
140
 |
 |

Table of Contents
Index to Financial Statements
NOTES TO THE CONSOLIDATED FINANCIAL STATEMENTS—(Continued)
During 2006, we recorded in reorganization items, net, a settlement gain of $1.3 billion related to the termination of the Pilot Plan and the
corresponding non-qualified plans.
During 2005, we recorded settlement charges totaling $388 million on our Consolidated Statement of Operations. These charges primarily related to the
Pilot Plan and resulted from lump sum distributions to pilots who retired. We also recorded a net curtailment loss of $434 million on our Consolidated
Statement of Operations. The $434 million net curtailment loss consists of (1) a $13 million curtailment gain recorded in the December 2005 quarter related to
the freeze of benefit accruals effective December 31, 2005 for the Non-Pilot Plan and (2) a curtailment loss of $447 million related to the impact of the
reduction of non-pilot jobs announced in November 2004 and the freeze of service accruals under the Pilot Plan effective December 31, 2004.
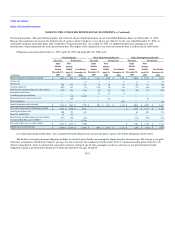
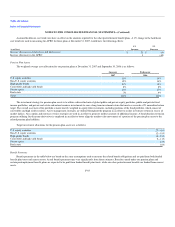
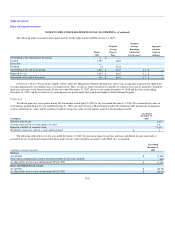
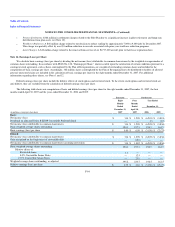
Assumptions
We used the following actuarial assumptions to determine our benefit obligations at December 31, 2007, April 30, 2007 and September 30, 2006 and
our net periodic (benefit) cost for the periods presented:
Successor Predecessor
Benefit Obligations(1)
December 31,
2007
April 30,
2007
September 30,
2006
Weighted average discount rate 6.08% 5.96% 5.88%
Rate of increase in future compensation levels 0.48% 0.48% 0.36%
Assumed healthcare cost trend rate(2) 8.50% 8.50% 8.50%
Successor Predecessor
Eight Months
Ended
December 31,
2007
Four Months
Ended April 30,
2007
Year Ended
December 31,
Net Periodic Benefit Cost(3) 2006 2005
Weighted average discount rate—pension benefit 6.01% 5.99% 5.67% 5.81%
Weighted average discount rate—other postretirement benefit 5.63% 5.63% 5.65% 6.10%
Weighted average discount rate—other postemployment benefit 6.00% 5.63% 5.72% 6.10%
Rate of increase (decrease) in future compensation levels 0.48% 0.36% 0.72% -1.28%
Weighted average expected long-term rate of return on plan assets 8.97% 8.96% 8.87% 9.00%
Assumed healthcare cost trend rate(2) 8.50% 8.50% 9.50% 9.50%
(1) Our 2007 and 2006 benefit obligations are measured using the RP 2000 combined healthy mortality table projected to 2010 and 2006, respectively.
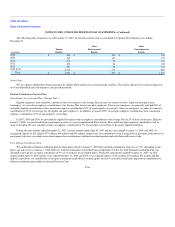
(2) The assumed healthcare cost trend rate at December 31, 2007 is assumed to decline gradually to 5.00% by 2014 and remain level thereafter.
(3) Our 2007, 2006 and 2005 assumptions reflect various remeasurements of certain portions of our obligations and represent the weighted average of the assumptions used for each
measurement date.
The expected long-term rate of return on our plan assets was based on plan-specific investment studies using historical market return and volatility data
with forward looking estimates based on existing financial market conditions and forecasts. Modest excess return expectations versus some market indices
were incorporated into the return projections based on the actively managed structure of our investment program and its record of achieving such returns
historically.
F-54