Delta Airlines 2007 Annual Report Download - page 120
Download and view the complete annual report
Please find page 120 of the 2007 Delta Airlines annual report below. You can navigate through the pages in the report by either clicking on the pages listed below, or by using the keyword search tool below to find specific information within the annual report.-
 1
1 -
2
-
3
-
4
-
5
-
6
-
7
-
8
-
9
-
10
-
11
-
12
-
13
-
14
-
15
-
16
-
17
-
18
-
19
-
20
-
21
-
22
-
23
-
24
-
25
-
26
-
27
-
28
-
29
-
30
-
31
-
32
-
33
-
34
-
35
-
36
-
37
-
38
-
39
-
40
-
41
-
42
-
43
-
44
-
45
-
46
-
47
-
48
-
49
-
50
-
51
-
52
-
53
-
54
-
55
-
56
-
57
-
58
-
59
-
60
-
61
-
62
-
63
-
64
-
65
-
66
-
67
-
68
-
69
-
70
-
71
-
72
-
73
-
74
-
75
-
76
-
77
-
78
-
79
-
80
-
81
-
82
-
83
-
84
-
85
-
86
-
87
-
88
-
89
-
90
-
91
-
92
-
93
-
94
-
95
-
96
-
97
-
98
-
99
-
100
-
101
-
102
-
103
-
104
-
105
-
106
-
107
-
108
-
109
-
 110
110 -
 111
111 -
 112
112 -
 113
113 -
 114
114 -
 115
115 -
 116
116 -
 117
117 -
 118
118 -
 119
119 -
 120
120 -
 121
121 -
 122
122 -
 123
123 -
 124
124 -
 125
125 -
 126
126 -
 127
127 -
 128
128 -
 129
129 -
 130
130 -
131
-
132
-
133
-
134
-
135
-
136
-
137
-
138
-
139
-
140
 |
 |

Table of Contents
Index to Financial Statements
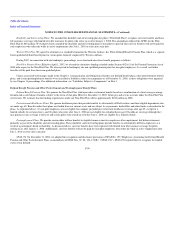
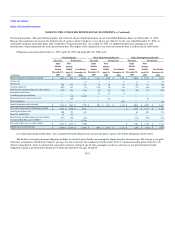
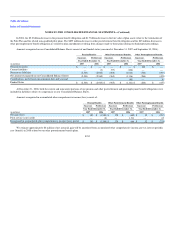
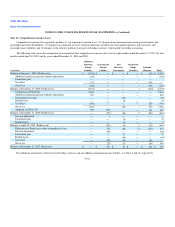
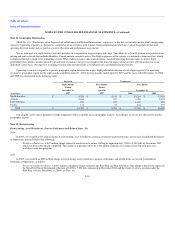
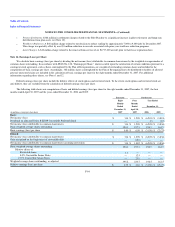
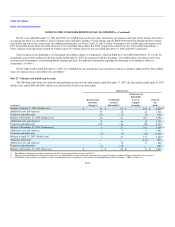
NOTES TO THE CONSOLIDATED FINANCIAL STATEMENTS—(Continued)
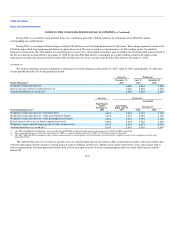
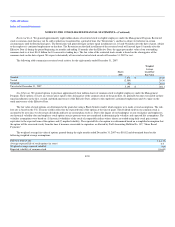
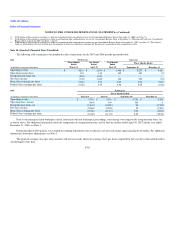
The following table summarizes stock option activity for the eight months ended December 31, 2007:
Shares
(000)
Weighted
Average
Exercise
Price
Weighted
Average
Remaining
Contractual
Life (in years)
Aggregate
Intrinsic
Value (in
millions)
Outstanding at the beginning of the period — $ —
Granted 3,955 18.87
Exercised — —
Forfeited (9) 18.84
Outstanding at the end of the period 3,946 $ 18.87 8.6 $ —
Expected to vest 3,452 $ 18.87 9.1 $ —
Exercisable at the end of the period 244 $ 18.84 1.7 $ —
Performance Shares. We granted to eligible officers under the Management Program performance shares with an aggregate target payout opportunity
covering approximately one million shares of common stock. These awards are long-term incentives payable in common stock and are generally contingent
upon our achieving certain financial goals for the year ended December 31, 2007, the two years ending December 31, 2008 and the three years ending
December 31, 2009, and the occurrence of a contemporaneous payout under the broad-based employee Profit Sharing Program.
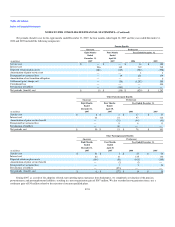
Predecessor
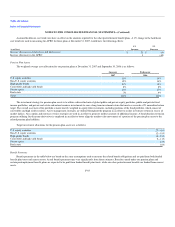
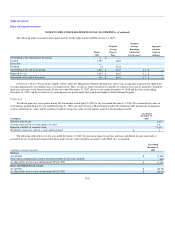
We did not grant any stock options during the four months ended April 30, 2007 or the year ended December 31, 2006. The estimated fair values of
stock options granted during the year ended December 31, 2005 were derived using a Black-Scholes model. The following table includes the assumptions
used in estimating fair values and the resulting weighted average fair value of stock options granted in the periods presented:
Assumption
Year Ended
December 31,
2005
Risk-free interest rate 3.8%
Average expected life of stock options (in years) 3.0
Expected volatility of common stock 73.6%
Weighted average fair value of a stock option granted $ 2
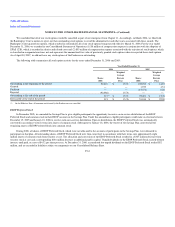
The following table reflects, for the year ended December 31, 2005, the pro forma impact to net loss and basic and diluted loss per share had we
accounted for our stock-based compensation plans under the fair value method in accordance with SFAS 123, as amended:
(in millions, except per share data)
Year Ended
December 31,
2005
Net loss:
As reported $ (3,818)
Stock option compensation expense determined under the fair value method (108)
As adjusted for the fair value method under SFAS 123R $ (3,926)
Basic and diluted loss per share:
As reported $ (23.75)
As adjusted for the fair value method under SFAS 123R $ (24.42)
F-60