Delta Airlines 2007 Annual Report Download - page 101
Download and view the complete annual report
Please find page 101 of the 2007 Delta Airlines annual report below. You can navigate through the pages in the report by either clicking on the pages listed below, or by using the keyword search tool below to find specific information within the annual report.-
 1
1 -
2
-
3
-
4
-
5
-
6
-
7
-
8
-
9
-
10
-
11
-
12
-
13
-
14
-
15
-
16
-
17
-
18
-
19
-
20
-
21
-
22
-
23
-
24
-
25
-
26
-
27
-
28
-
29
-
30
-
31
-
32
-
33
-
34
-
35
-
36
-
37
-
38
-
39
-
40
-
41
-
42
-
43
-
44
-
45
-
46
-
47
-
48
-
49
-
50
-
51
-
52
-
53
-
54
-
55
-
56
-
57
-
58
-
59
-
60
-
61
-
62
-
63
-
64
-
65
-
66
-
67
-
68
-
69
-
70
-
71
-
72
-
73
-
74
-
75
-
76
-
77
-
78
-
79
-
80
-
81
-
82
-
83
-
84
-
85
-
86
-
87
-
88
-
89
-
90
-
 91
91 -
 92
92 -
 93
93 -
 94
94 -
 95
95 -
 96
96 -
 97
97 -
 98
98 -
 99
99 -
 100
100 -
 101
101 -
 102
102 -
 103
103 -
 104
104 -
 105
105 -
 106
106 -
 107
107 -
 108
108 -
 109
109 -
 110
110 -
 111
111 -
112
-
113
-
114
-
115
-
116
-
117
-
118
-
119
-
120
-
121
-
122
-
123
-
124
-
125
-
126
-
127
-
128
-
129
-
130
-
131
-
132
-
133
-
134
-
135
-
136
-
137
-
138
-
139
-
140
 |
 |

Table of Contents
Index to Financial Statements
NOTES TO THE CONSOLIDATED FINANCIAL STATEMENTS—(Continued)
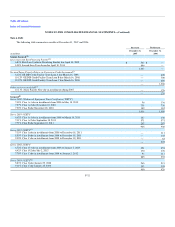
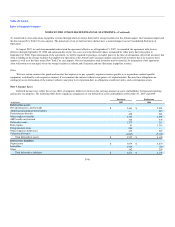
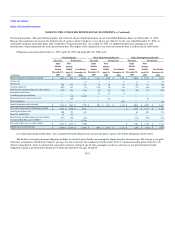
The following table shows by carrier and contract (1) the number of aircraft in Delta Connection operation as of December 31, 2007, (2) the number of
aircraft scheduled to be in Delta Connection operation as of December 31, 2008, (3) the number of aircraft scheduled to be in Delta Connection operation
immediately prior to the expiration date of the agreement and (4) the expiration date of the agreement:
Carrier(1)
Number of
Aircraft in
Operation
as of
December 31,
2007
Number of
Aircraft
Scheduled to
be in
Operation
as of
December 31,
2008
Number of
Aircraft
Scheduled
to be in
Operation
Immediately
Prior to the
Expiration
of the
Agreement
Expiration
Date of
Agreement
ASA 153 141 141 2020
SkyWest Airlines 82 77 82 2020
ASA/SkyWest Airlines(1) 10 12 12 2012
Chautauqua 39 33 24 2016
Freedom (ERJ-145 aircraft)(2) 36 28 22 2012
Freedom (CRJ-900 aircraft)(2) 2 12 14 2017
Shuttle America 16 16 16 2019
ExpressJet 10 10 10 2009
Pinnacle 1 14 16 2017
Total 349 343 337
The table above was not subject to the audit procedures of our Independent Registered Public Accounting Firm.
(1) We have an agreement with ASA, SkyWest Airlines and SkyWest, Inc. ("SkyWest"), the parent company of ASA and SkyWest Airlines, under which the parties collectively determine
whether the aircraft are operated by ASA or SkyWest Airlines.
(2) We have separate agreements with Freedom that involve different aircraft types, expiration dates and terms.
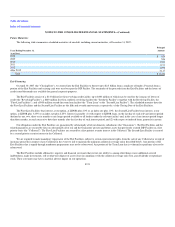
The following table shows the available seat miles ("ASMs") and revenue passenger miles ("RPMs") operated for us under capacity purchase
agreements with the following seven unaffiliated Contract Carriers for the years ended December 31, 2007, 2006 and 2005:
• SkyWest Airlines and Chautauqua for all periods presented;
• Shuttle America for the years ended December 31, 2007 and 2006 and from September 1 through December 31, 2005;
• ASA for the years ended December 31, 2007 and 2006 and from September 8 through December 31, 2005. On September 7, 2005, we sold ASA
to SkyWest;
• Freedom for the years ended December 31, 2007 and 2006 and from October 1 to December 31, 2005;
• ExpressJet from June 1, 2007 to December 31, 2007; and
• Pinnacle from December 1, 2007 to December 31, 2007.
(in millions, except for number of aircraft operated) 2007 2006 2005
ASMs 17,881 15,390 8,275
RPMs 14,005 11,931 5,961
Number of aircraft operated, end of period 349 324 265
The table above was not subject to the audit procedures of our Independent Registered Public Accounting Firm.
F-41