Delta Airlines 2007 Annual Report Download - page 123
Download and view the complete annual report
Please find page 123 of the 2007 Delta Airlines annual report below. You can navigate through the pages in the report by either clicking on the pages listed below, or by using the keyword search tool below to find specific information within the annual report.-
 1
1 -
2
-
3
-
4
-
5
-
6
-
7
-
8
-
9
-
10
-
11
-
12
-
13
-
14
-
15
-
16
-
17
-
18
-
19
-
20
-
21
-
22
-
23
-
24
-
25
-
26
-
27
-
28
-
29
-
30
-
31
-
32
-
33
-
34
-
35
-
36
-
37
-
38
-
39
-
40
-
41
-
42
-
43
-
44
-
45
-
46
-
47
-
48
-
49
-
50
-
51
-
52
-
53
-
54
-
55
-
56
-
57
-
58
-
59
-
60
-
61
-
62
-
63
-
64
-
65
-
66
-
67
-
68
-
69
-
70
-
71
-
72
-
73
-
74
-
75
-
76
-
77
-
78
-
79
-
80
-
81
-
82
-
83
-
84
-
85
-
86
-
87
-
88
-
89
-
90
-
91
-
92
-
93
-
94
-
95
-
96
-
97
-
98
-
99
-
100
-
101
-
102
-
103
-
104
-
105
-
106
-
107
-
108
-
109
-
110
-
111
-
112
-
 113
113 -
 114
114 -
 115
115 -
 116
116 -
 117
117 -
 118
118 -
 119
119 -
 120
120 -
 121
121 -
 122
122 -
 123
123 -
 124
124 -
 125
125 -
 126
126 -
 127
127 -
 128
128 -
 129
129 -
 130
130 -
 131
131 -
 132
132 -
 133
133 -
134
-
135
-
136
-
137
-
138
-
139
-
140
 |
 |

Table of Contents
Index to Financial Statements
NOTES TO THE CONSOLIDATED FINANCIAL STATEMENTS—(Continued)
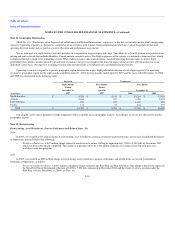
Note 14. Geographic Information
SFAS No. 131, "Disclosures about Segments of an Enterprise and Related Information," requires us to disclose certain information about our operating
segments. Operating segments are defined as components of an enterprise with separate financial information which are evaluated regularly by the chief
operating decision maker and are used in resource allocation and performance assessments.
We are managed as a single business unit that provides air transportation for passengers and cargo. This allows us to benefit from an integrated revenue
pricing and route network that includes Mainline, Comair and our contract carriers. The flight equipment of the carriers is combined to form one fleet, which
is deployed through a single route scheduling system. When making resource allocation decisions, our chief operating decision maker evaluates flight
profitability data, which considers aircraft type and route economics, but gives no weight to the financial impact of the resource allocation decision on an
individual carrier basis. Our objective in making resource allocation decisions is to optimize our consolidated financial results.
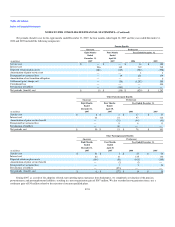
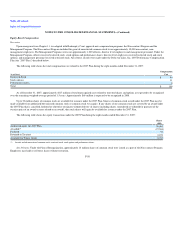
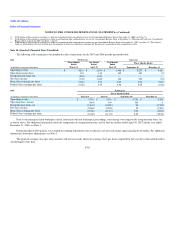
Operating revenue is assigned to a specific geographic region based on the origin, flight path and destination of each flight segment. Our operating
revenue by geographic region for the eight months ended December 31, 2007, the four months ended April 30, 2007 and the years ended December 31, 2006
and 2005 are summarized in the following table:
Successor Predecessor
(in millions)
Eight Months
Ended
December 31,
2007
Four Months
Ended
April 30,
2007
Year Ended
December 31,
2006 2005
North America $ 9,380 $ 4,314 $ 13,204 $ 12,918
Atlantic 2,884 947 3,058 2,554
Latin America 923 478 1,102 851
Pacific 171 57 168 157
Total $ 13,358 $ 5,796 $ 17,532 $ 16,480
Our tangible assets consist primarily of flight equipment, which is mobile across geographic markets. Accordingly, assets are not allocated to specific
geographic regions.
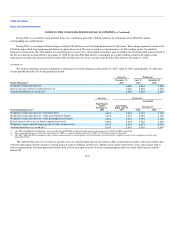
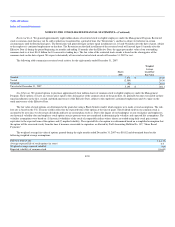
Note 15. Restructuring
Restructuring, Asset Writedowns, Pension Settlements and Related Items, Net
2006
In 2006, we recorded a $13 million charge in restructuring, asset writedowns, pension settlements and related items, net on our Consolidated Statement
of Operations, primarily due to the following:
• Workforce Reduction. A $29 million charge related to our decision to reduce staffing by approximately 7,000 to 9,000 jobs by December 2007,
which has been substantially completed. This charge was partially offset by a $21 million reduction in accruals associated with prior year
workforce reduction programs.
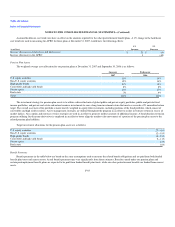
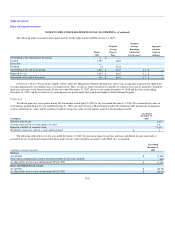
2005
In 2005, we recorded an $888 million charge in restructuring, asset writedowns, pension settlements and related items, net on our Consolidated
Statement of Operations, as follows:
• Pension Curtailment Charge. A $447 million curtailment charge related to our Pilot Plan and Non-Pilot Plan. This charge related to the impact on
the Non-Pilot Plan of the planned reduction of 6,000 to 7,000 jobs announced in November 2004 and the freeze of service accruals under the
Pilot Plan effective December 31, 2004 (see Note 10).
F-63