Delta Airlines 2007 Annual Report Download - page 44
Download and view the complete annual report
Please find page 44 of the 2007 Delta Airlines annual report below. You can navigate through the pages in the report by either clicking on the pages listed below, or by using the keyword search tool below to find specific information within the annual report.-
 1
1 -
2
-
3
-
4
-
5
-
6
-
7
-
8
-
9
-
10
-
11
-
12
-
13
-
14
-
15
-
16
-
17
-
18
-
19
-
20
-
21
-
22
-
23
-
24
-
25
-
26
-
27
-
28
-
29
-
30
-
31
-
32
-
33
-
 34
34 -
 35
35 -
 36
36 -
 37
37 -
 38
38 -
 39
39 -
 40
40 -
 41
41 -
 42
42 -
 43
43 -
 44
44 -
 45
45 -
 46
46 -
 47
47 -
 48
48 -
 49
49 -
 50
50 -
 51
51 -
 52
52 -
 53
53 -
 54
54 -
55
-
56
-
57
-
58
-
59
-
60
-
61
-
62
-
63
-
64
-
65
-
66
-
67
-
68
-
69
-
70
-
71
-
72
-
73
-
74
-
75
-
76
-
77
-
78
-
79
-
80
-
81
-
82
-
83
-
84
-
85
-
86
-
87
-
88
-
89
-
90
-
91
-
92
-
93
-
94
-
95
-
96
-
97
-
98
-
99
-
100
-
101
-
102
-
103
-
104
-
105
-
106
-
107
-
108
-
109
-
110
-
111
-
112
-
113
-
114
-
115
-
116
-
117
-
118
-
119
-
120
-
121
-
122
-
123
-
124
-
125
-
126
-
127
-
128
-
129
-
130
-
131
-
132
-
133
-
134
-
135
-
136
-
137
-
138
-
139
-
140
 |
 |
Table of Contents
Index to Financial Statements
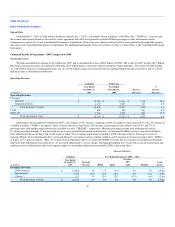
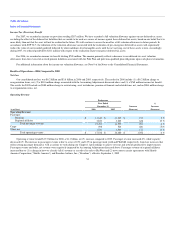
improved revenue environment. Our 2006 cash flows from operating activities also include a $116 million decrease in our restricted cash balance primarily
due to a release of cash from restricted to operating under agreements we reached with certain vendors. In 2005, our restricted cash balance increased
significantly primarily due to cash holdbacks under our Visa/MasterCard credit card processing agreement.
Cash flows from investing activities
Cash used in investing activities totaled $625 million and $361 million for 2007 and 2006, respectively. Cash used in investing activities in 2007
reflects an increase in investment of $545 million for flight equipment and advanced payments for aircraft commitments and $78 million for ground property
and equipment. During 2007, restricted cash decreased by $185 million. In addition, we received $34 million and $83 million from the sale of our investments
in priceline.com Incorporated and ARINC Incorporated, respectively.
Cash used in investing activities totaled $361 million for 2006, compared to cash provided by investing activities of $22 million for 2005. This change
reflects a $401 million decrease in cash used for the purchase of flight and ground equipment in 2006. Our 2005 cash flows from investing activities include
$842 million in proceeds from our sale of ASA and certain flight equipment.
Cash flows from financing activities
Cash used in financing activities totaled $120 million and $606 million for 2007 and 2006, respectively. Cash used in financing activities in 2007
primarily reflects (1) the repayment of the DIP Facility with a portion of the proceeds available under the Exit Facilities and existing cash, (2) the prepayment
of $863 million of secured debt with a portion of the proceeds from the sale of the 2007-1 Certificates and (3) scheduled principal payments on long-term debt
and capital lease obligations. During 2007, we also received proceeds from an amendment to the Spare Parts Loan, as discussed above.
Cash used in financing activities totaled $606 million for 2006, compared to cash provided by financing activities of $830 million for 2005. This change
is primarily due to the net proceeds we received under the DIP Facility shortly after our Chapter 11 filing in 2005. While in Chapter 11, we ceased making
payments on our unsecured debt.
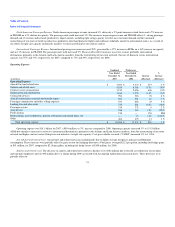
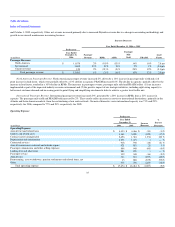
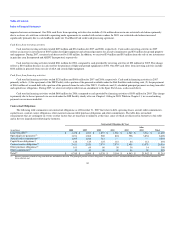
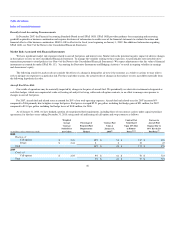
Contractual Obligations
The following table summarizes our contractual obligations as of December 31, 2007 that relate to debt, operating leases, aircraft order commitments,
capital leases, contract carrier obligations, other material, noncancelable purchase obligations and other commitments. The table does not include
commitments that are contingent on events or other factors that are uncertain or unknown at this time, some of which are discussed in footnotes to this table
and in the text immediately following the footnotes.
Contractual Obligations by Year
(in millions) 2008 2009 2010 2011 2012
After
2012 Total
Long-term debt(1) $ 1,478 $ 1,035 $ 1,857 $ 1,588 $ 1,567 $ 3,964 $ 11,489
Operating lease payments(2) 1,231 1,062 969 824 758 3,854 8,698
Aircraft order commitments(3) 1,295 1,248 712 — — — 3,255
Capital lease obligations(4) 128 125 125 118 84 112 692
Contract carrier obligations(5) 2,411 2,520 2,575 2,574 2,458 13,978 26,516
Other purchase obligations(6) 161 69 60 50 36 14 390
Other commitments(7) 41 40 40 40 40 20 221
Total(8) $ 6,745 $ 6,099 $ 6,338 $ 5,194 $ 4,943 $ 21,942 $ 51,261
(1) Interest payments related to long-term debt are included in the table. The principal portion of these obligations is included in our Consolidated Balance Sheets. Estimated amounts for
future interest and
39