Delta Airlines 2007 Annual Report Download - page 40
Download and view the complete annual report
Please find page 40 of the 2007 Delta Airlines annual report below. You can navigate through the pages in the report by either clicking on the pages listed below, or by using the keyword search tool below to find specific information within the annual report.-
 1
1 -
2
-
3
-
4
-
5
-
6
-
7
-
8
-
9
-
10
-
11
-
12
-
13
-
14
-
15
-
16
-
17
-
18
-
19
-
20
-
21
-
22
-
23
-
24
-
25
-
26
-
27
-
28
-
29
-
 30
30 -
 31
31 -
 32
32 -
 33
33 -
 34
34 -
 35
35 -
 36
36 -
 37
37 -
 38
38 -
 39
39 -
 40
40 -
 41
41 -
 42
42 -
 43
43 -
 44
44 -
 45
45 -
 46
46 -
 47
47 -
 48
48 -
 49
49 -
 50
50 -
51
-
52
-
53
-
54
-
55
-
56
-
57
-
58
-
59
-
60
-
61
-
62
-
63
-
64
-
65
-
66
-
67
-
68
-
69
-
70
-
71
-
72
-
73
-
74
-
75
-
76
-
77
-
78
-
79
-
80
-
81
-
82
-
83
-
84
-
85
-
86
-
87
-
88
-
89
-
90
-
91
-
92
-
93
-
94
-
95
-
96
-
97
-
98
-
99
-
100
-
101
-
102
-
103
-
104
-
105
-
106
-
107
-
108
-
109
-
110
-
111
-
112
-
113
-
114
-
115
-
116
-
117
-
118
-
119
-
120
-
121
-
122
-
123
-
124
-
125
-
126
-
127
-
128
-
129
-
130
-
131
-
132
-
133
-
134
-
135
-
136
-
137
-
138
-
139
-
140
 |
 |

Table of Contents
Index to Financial Statements
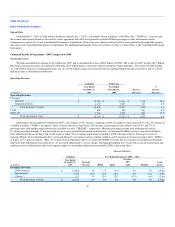
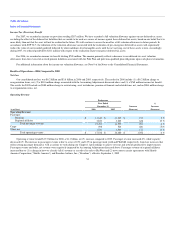
and October 1, 2005, respectively. Other, net revenue increased primarily due to increased Skymiles revenue due to a change in accounting methodology and
growth in our aircraft maintenance in-sourcing business.
Increase (Decrease)
Year Ended December 31, 2006 vs. 2005
Predecessor
(in millions)
Year Ended
December 31,
2006
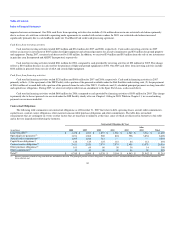
Passenger
Revenue RPMs ASMs
Passenger
Mile
Yield PRASM
Load
Factor
Passenger Revenue:
North America $ 11,678 2% (10)% (13)% 14% 18% 2.8 pts
International 3,695 23% 20% 21% 2% 2% (0.6)pts
Charter revenue 120 2% (21)% (9)% 28% 12% (5.3)pts
Total passenger revenue $ 15,493 6% (3)% (6)% 10% 12% 2.0 pts
North American Passenger Revenue. North American passenger revenue increased 2%, driven by a 14% increase in passenger mile yield and a 2.8
point increase in load factor, which were partially offset by a 13% decline in capacity. PRASM increased 18%. The decline in capacity, partially offset by the
increase in load factor, resulted in a 10% decline in RPMs. The increases in passenger revenue, passenger mile yield and PRASM reflect (1) fare increases
implemented as part of the improved industry revenue environment and (2) the positive impact of our strategic initiatives, including right-sizing capacity to
better meet customer demand and increasing point-to-point flying and simplifying our domestic hubs to achieve a greater local traffic mix.
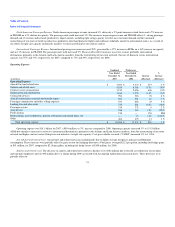
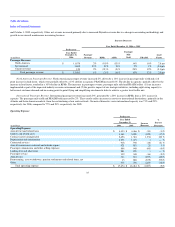
International Passenger Revenue. International passenger revenue increased 23%, generated by a 20% increase in RPMs from a 21% increase in
capacity. The passenger mile yield and PRASM both increased by 2%. These results reflect increases in service to international destinations, primarily in the
Atlantic and Latin America markets, from the restructuring of our route network. Our mix of domestic versus international capacity was 71% and 29%,
respectively, for 2006, compared to 77% and 23%, respectively, for 2005.
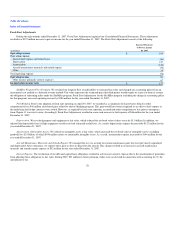
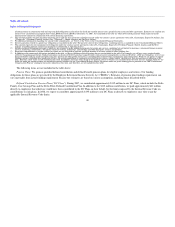
Operating Expense
Predecessor
Increase
(Decrease)
%
Increase
(Decrease)
Year Ended
December 31,
(in millions) 2006 2005
Operating Expense:
Aircraft fuel and related taxes $ 4,433 $ 4,466 $ (33) (1)%
Salaries and related costs 4,365 5,290 (925) (17)%
Contract carrier arrangements 2,656 1,318 1,338 102 %
Depreciation and amortization 1,276 1,273 3 — %
Contracted services 918 936 (18) (2) %
Aircraft maintenance materials and outside repairs 921 893 28 3 %
Passenger commissions and other selling expenses 888 948 (60) (6)%
Landing fees and other rents 881 878 3 — %
Passenger service 332 348 (16) (5)%
Aircraft rent 316 543 (227) (42)%
Restructuring, asset writedowns, pension settlements and related items, net 13 888 (875) (99)%
Other 475 700 (225) (32)%
Total operating expense $ 17,474 $ 18,481 $ (1,007) (5)%
35