Delta Airlines 2007 Annual Report Download - page 35
Download and view the complete annual report
Please find page 35 of the 2007 Delta Airlines annual report below. You can navigate through the pages in the report by either clicking on the pages listed below, or by using the keyword search tool below to find specific information within the annual report.-
 1
1 -
2
-
3
-
4
-
5
-
6
-
7
-
8
-
9
-
10
-
11
-
12
-
13
-
14
-
15
-
16
-
17
-
18
-
19
-
20
-
21
-
22
-
23
-
24
-
 25
25 -
 26
26 -
 27
27 -
 28
28 -
 29
29 -
 30
30 -
 31
31 -
 32
32 -
 33
33 -
 34
34 -
 35
35 -
 36
36 -
 37
37 -
 38
38 -
 39
39 -
 40
40 -
 41
41 -
 42
42 -
 43
43 -
 44
44 -
 45
45 -
46
-
47
-
48
-
49
-
50
-
51
-
52
-
53
-
54
-
55
-
56
-
57
-
58
-
59
-
60
-
61
-
62
-
63
-
64
-
65
-
66
-
67
-
68
-
69
-
70
-
71
-
72
-
73
-
74
-
75
-
76
-
77
-
78
-
79
-
80
-
81
-
82
-
83
-
84
-
85
-
86
-
87
-
88
-
89
-
90
-
91
-
92
-
93
-
94
-
95
-
96
-
97
-
98
-
99
-
100
-
101
-
102
-
103
-
104
-
105
-
106
-
107
-
108
-
109
-
110
-
111
-
112
-
113
-
114
-
115
-
116
-
117
-
118
-
119
-
120
-
121
-
122
-
123
-
124
-
125
-
126
-
127
-
128
-
129
-
130
-
131
-
132
-
133
-
134
-
135
-
136
-
137
-
138
-
139
-
140
 |
 |

Table of Contents
Index to Financial Statements
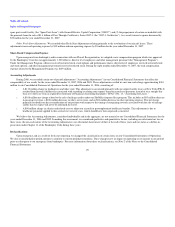
Sale of ASA
On September 7, 2005, we sold Atlantic Southeast Airlines, Inc. ("ASA"), our wholly owned subsidiary, to SkyWest, Inc. ("SkyWest"). After the sale,
the revenue and expense related to our contract carrier agreement with ASA are reported as regional affiliates passenger revenue and contract carrier
arrangements, respectively, in our Consolidated Statements of Operations. Prior to the sale, expenses related to ASA were reported in the applicable expense
line item in our Consolidated Statements of Operations. For additional information on the sale of ASA, see Note 11 of the Notes to the Consolidated Financial
Statements.
Combined Results of Operations—2007 Compared to 2006
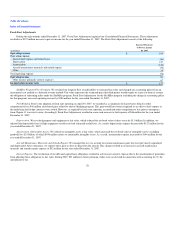
Net Income (Loss)
We had consolidated net income of $1.6 billion for 2007, and a consolidated net loss of $6.2 billion for 2006. The results for 2007 include a $1.2 billion
gain from reorganization items, net, primarily reflecting a $2.1 billion gain in connection with our emergence from bankruptcy. The results for 2006 include
(1) a $6.2 billion charge to reorganization items, net, (2) a $310 million charge associated with the Accounting Adjustments discussed above and (3) a $765
million income tax benefit discussed below.
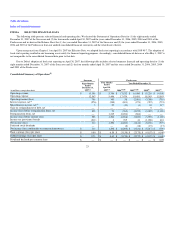
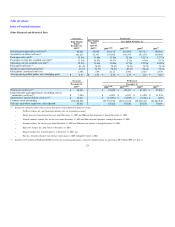
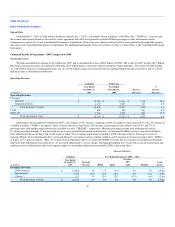
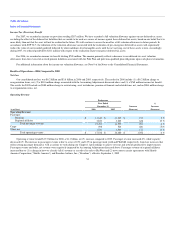
Operating Revenue
Combined Predecessor
(in millions)
Year Ended
December 31,
2007
Year Ended
December 31,
2006
Increase
(Decrease)
%
Increase
(Decrease)
Operating Revenue:
Passenger:
Mainline $ 12,758 $ 11,640 $ 1,118 10 %
Regional affiliates 4,170 3,853 317 8 %
Total passenger revenue 16,928 15,493 1,435 9 %
Cargo 482 498 (16) (3)%
Other, net 1,744 1,541 203 13 %
Total operating revenue $ 19,154 $ 17,532 $ 1,622 9 %
Operating revenue totaled $19.2 billion for 2007, a $1.6 billion, or 9%, increase compared to 2006. Passenger revenue increased 9% on a 3% increase in
available seat miles ("ASMs"), or capacity, and a 1.9 point increase in load factor. The increase in passenger revenue reflects a rise of 4% and 7% in
passenger mile yield and passenger revenue per available seat mile ("PRASM"), respectively. Mainline passenger revenue increased primarily due to
(1) strong passenger demand, (2) our increased service to more profitable international destinations, (3) increased SkyMiles revenue associated with Fresh
Start Adjustments discussed above and (4) the negative impact of Accounting Adjustments recorded in 2006 as discussed above. Passenger revenue of
regional affiliates increased primarily due to increased flying by our contract carriers, which resulted in an 8% increase in revenue passenger miles ("RPMs"),
or traffic, on 7% greater capacity. Other, net revenue increased primarily due to (1) increased SkyMiles revenue due to a change in accounting methodology
and Fresh Start Adjustments discussed above, (2) increased administrative service charges and baggage handling fees, (3) growth in aircraft maintenance and
staffing services to third parties and (4) the negative impact of Accounting Adjustments recorded in 2006 as discussed above.
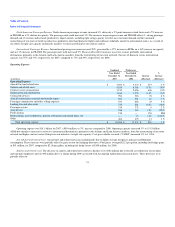
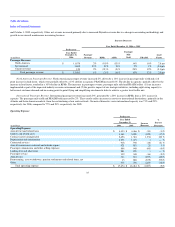
Increase (Decrease)
Year Ended December 31, 2007 vs. 2006
Combined
(in millions)
Year Ended
December 31,
2007
Passenger
Revenue RPMs ASMs
Passenger
Mile
Yield PRASM
Load
Factor
Passenger Revenue:
North America $ 12,062 3% — % (3)% 3% 7% 2.5 pts
International 4,745 28% 17% 16% 9% 11% 1.0 pts
Charter 121 1% 21% 12% (17)% (9)% 3.2 pts
Total passenger revenue $ 16,928 9% 5% 3% 4% 7% 1.9 pts
30