Berkshire Hathaway 2004 Annual Report Download - page 8
Download and view the complete annual report
Please find page 8 of the 2004 Berkshire Hathaway annual report below. You can navigate through the pages in the report by either clicking on the pages listed below, or by using the keyword search tool below to find specific information within the annual report.-
 1
1 -
 2
2 -
 3
3 -
 4
4 -
 5
5 -
 6
6 -
 7
7 -
 8
8 -
 9
9 -
 10
10 -
 11
11 -
 12
12 -
 13
13 -
 14
14 -
 15
15 -
 16
16 -
 17
17 -
 18
18 -
 19
19 -
20
-
21
-
22
-
23
-
24
-
25
-
26
-
27
-
28
-
29
-
30
-
31
-
32
-
33
-
34
-
35
-
36
-
37
-
38
-
39
-
40
-
41
-
42
-
43
-
44
-
45
-
46
-
47
-
48
-
49
-
50
-
51
-
52
-
53
-
54
-
55
-
56
-
57
-
58
-
59
-
60
-
61
-
62
-
63
-
64
-
65
-
66
-
67
-
68
-
69
-
70
-
71
-
72
-
73
-
74
-
75
-
76
-
77
-
78
-
79
-
80
-
81
-
82
 |
 |

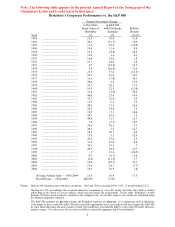
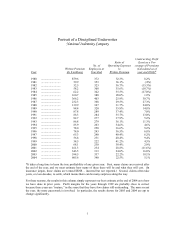
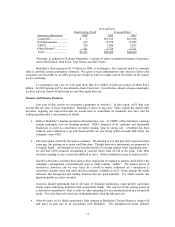
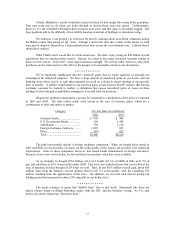
Portrait of a Disciplined Underwriter
National Indemnity Company
Year
Written Premium
(In $ millions)
No. of
Employees at
Year-End
Ratio of
Operating Expenses
to
Written Premium
Underwriting Profit
(Loss) as a Per-
centage of Premiums
(Calculated as of
year end 2004)*
1980 ........................... $79.6 372 32.3% 8.2%
1981 ........................... 59.9 353 36.1% (.8%)
1982 ........................... 52.5 323 36.7% (15.3%)
1983 ........................... 58.2 308 35.6% (18.7%)
1984 ........................... 62.2 342 35.5% (17.0%)
1985 ........................... 160.7 380 28.0% 1.9%
1986 ........................... 366.2 403 25.9% 30.7%
1987 ........................... 232.3 368 29.5% 27.3%
1988 ........................... 139.9 347 31.7% 24.8%
1989 ........................... 98.4 320 35.9% 14.8%
1990 ........................... 87.8 289 37.4% 7.0%
1991 ........................... 88.3 284 35.7% 13.0%
1992 ........................... 82.7 277 37.9% 5.2%
1993 ........................... 86.8 279 36.1% 11.3%
1994 ........................... 85.9 263 34.6% 4.6%
1995 ........................... 78.0 258 36.6% 9.2%
1996 ........................... 74.0 243 36.5% 6.8%
1997 ........................... 65.3 240 40.4% 6.2%
1998 ........................... 56.8 231 40.4% 9.4%
1999 ........................... 54.5 222 41.2% 4.5%
2000 ........................... 68.1 230 38.4% 2.9%
2001 ........................... 161.3 254 28.8% (11.6%)
2002 ........................... 343.5 313 24.0% 16.8%
2003 ........................... 594.5 337 22.2% 18.1%
2004 ........................... 605.6 340 22.5% 5.1%
*It takes a long time to learn the true profitability of any given year. First, many claims are received after
the end of the year, and we must estimate how many of these there will be and what they will cost. (In
insurance jargon, these claims are termed IBNR – incurred but not reported.) Second, claims often take
years, or even decades, to settle, which means there can be many surprises along the way.
For these reasons, the results in this column simply represent our best estimate at the end of 2004 as to how
we have done in prior years. Profit margins for the years through 1999 are probably close to correct
because these years are “mature,” in the sense that they have few claims still outstanding. The more recent
the year, the more guesswork is involved. In particular, the results shown for 2003 and 2004 are apt to
change significantly.
7