Berkshire Hathaway 2004 Annual Report Download - page 17
Download and view the complete annual report
Please find page 17 of the 2004 Berkshire Hathaway annual report below. You can navigate through the pages in the report by either clicking on the pages listed below, or by using the keyword search tool below to find specific information within the annual report.-
 1
1 -
2
-
3
-
4
-
5
-
6
-
 7
7 -
 8
8 -
 9
9 -
 10
10 -
 11
11 -
 12
12 -
 13
13 -
 14
14 -
 15
15 -
 16
16 -
 17
17 -
 18
18 -
 19
19 -
 20
20 -
 21
21 -
 22
22 -
 23
23 -
 24
24 -
 25
25 -
 26
26 -
 27
27 -
28
-
29
-
30
-
31
-
32
-
33
-
34
-
35
-
36
-
37
-
38
-
39
-
40
-
41
-
42
-
43
-
44
-
45
-
46
-
47
-
48
-
49
-
50
-
51
-
52
-
53
-
54
-
55
-
56
-
57
-
58
-
59
-
60
-
61
-
62
-
63
-
64
-
65
-
66
-
67
-
68
-
69
-
70
-
71
-
72
-
73
-
74
-
75
-
76
-
77
-
78
-
79
-
80
-
81
-
82
 |
 |

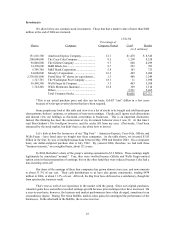
Investments
We show below our common stock investments. Those that had a market value of more than $600
million at the end of 2004 are itemized.
12/31/04
Percentage of
Shares Company Company Owned Cost* Market
(in $ millions)
151,610,700 American Express Company ................... 12.1 $1,470 $ 8,546
200,000,000 The Coca-Cola Company ........................ 8.3 1,299 8,328
96,000,000 The Gillette Company ............................. 9.7 600 4,299
14,350,600 H&R Block, Inc....................................... 8.7 223 703
6,708,760 M&T Bank Corporation .......................... 5.8 103 723
24,000,000 Moody’ s Corporation .............................. 16.2 499 2,084
2,338,961,000 PetroChina “H” shares (or equivalents)... 1.3 488 1,249
1,727,765 The Washington Post Company .............. 18.1 11 1,698
56,448,380 Wells Fargo & Company......................... 3.3 463 3,508
1,724,200 White Mountains Insurance..................... 16.0 369 1,114
Others ...................................................... 3,531 5,465
Total Common Stocks ............................. $9,056 $37,717
*This is our actual purchase price and also our tax basis; GAAP “cost” differs in a few cases
because of write-ups or write-downs that have been required.
Some people may look at this table and view it as a list of stocks to be bought and sold based upon
chart patterns, brokers’ opinions, or estimates of near-term earnings. Charlie and I ignore such distractions
and instead view our holdings as fractional ownerships in businesses. This is an important distinction.
Indeed, this thinking has been the cornerstone of my investment behavior since I was 19. At that time I
read Ben Graham’ s The Intelligent Investor, and the scales fell from my eyes. (Previously, I had been
entranced by the stock market, but didn’ t have a clue about how to invest.)
Let’ s look at how the businesses of our “Big Four” – American Express, Coca-Cola, Gillette and
Wells Fargo – have fared since we bought into these companies. As the table shows, we invested $3.83
billion in the four, by way of multiple transactions between May 1988 and October 2003. On a composite
basis, our dollar-weighted purchase date is July 1992. By yearend 2004, therefore, we had held these
“business interests,” on a weighted basis, about 12½ years.
In 2004, Berkshire’ s share of the group’ s earnings amounted to $1.2 billion. These earnings might
legitimately be considered “normal.” True, they were swelled because Gillette and Wells Fargo omitted
option costs in their presentation of earnings; but on the other hand they were reduced because Coke had a
non-recurring write-off.
Our share of the earnings of these four companies has grown almost every year, and now amounts
to about 31.3% of our cost. Their cash distributions to us have also grown consistently, totaling $434
million in 2004, or about 11.3% of cost. All in all, the Big Four have delivered us a satisfactory, though far
from spectacular, business result.
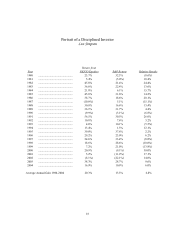
That’ s true as well of our experience in the market with the group. Since our original purchases,
valuation gains have somewhat exceeded earnings growth because price/earnings ratios have increased. On
a year-to-year basis, however, the business and market performances have often diverged, sometimes to an
extraordinary degree. During The Great Bubble, market-value gains far outstripped the performance of the
businesses. In the aftermath of the Bubble, the reverse was true.
16