Berkshire Hathaway 2004 Annual Report Download - page 65
Download and view the complete annual report
Please find page 65 of the 2004 Berkshire Hathaway annual report below. You can navigate through the pages in the report by either clicking on the pages listed below, or by using the keyword search tool below to find specific information within the annual report.-
 1
1 -
2
-
3
-
4
-
5
-
6
-
7
-
8
-
9
-
10
-
11
-
12
-
13
-
14
-
15
-
16
-
17
-
18
-
19
-
20
-
21
-
22
-
23
-
24
-
25
-
26
-
27
-
28
-
29
-
30
-
31
-
32
-
33
-
34
-
35
-
36
-
37
-
38
-
39
-
40
-
41
-
42
-
43
-
44
-
45
-
46
-
47
-
48
-
49
-
50
-
51
-
52
-
53
-
54
-
 55
55 -
 56
56 -
 57
57 -
 58
58 -
 59
59 -
 60
60 -
 61
61 -
 62
62 -
 63
63 -
 64
64 -
 65
65 -
 66
66 -
 67
67 -
 68
68 -
 69
69 -
 70
70 -
 71
71 -
 72
72 -
 73
73 -
 74
74 -
 75
75 -
76
-
77
-
78
-
79
-
80
-
81
-
82
 |
 |

64
Management’s Discussion (Continued)
Non-Insurance Businesses (Continued)
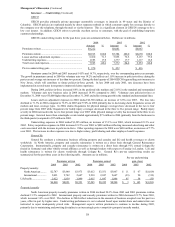
Shaw Industries
Floor covering sales generated by Shaw Industries totaled $5.17 billion in 2004, an increase of $514 million (11%)
over 2003. The increase in revenues was driven by an approximate 9% increase in square yards of carpet sold, higher net selling
prices and increased hard surface and rug sales. Sales in 2004 include those of two businesses acquired by Shaw (Georgia
Tufters and the North Georgia operations of the Dixie Group) in 2003, which contributed sales of $240 million in 2004 and $50
million in 2003. Pre-tax earnings in 2004 totaled $466 million, an increase of $30 million (7%) over 2003. During 2004,
petroleum-based raw material costs increased on several occasions. Production cost inflation was driven by higher petroleum-
based raw material and energy related costs. Sales price increases have lagged raw material supplier price increases resulting in
a decline in gross sales margins during 2004. Further margin declines in 2005 are possible.
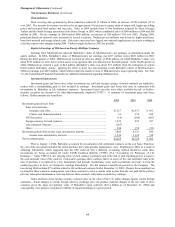
Equity in Earnings of MidAmerican Energy Holdings Company
Earnings from MidAmerican represent Berkshire’ s share of MidAmerican’ s net earnings, as determined under the
equity method. In 2004, Berkshire’ s share of MidAmerican’ s net earnings was $237 million versus $429 million in 2003.
During the third quarter of 2004, MidAmerican recorded an after-tax charge of $340 million (of which Berkshire’ s share was
about $255 million) to write down certain assets of an operation that was shut down in the third quarter. In the fourth quarter of
2004, MidAmerican realized a gain of $44 million (Berkshire’ s share was about $33 million) from the realization of certain
Enron-related bankruptcy claims. Ignoring the effect to these two non-recurring events Berkshire’ s share of MidAmerican’ s
2004 net earnings was $459 million, which reflects improved results at most of MidAmerican’ s major operating units. See Note
3 to the Consolidated Financial Statements for additional information regarding MidAmerican.
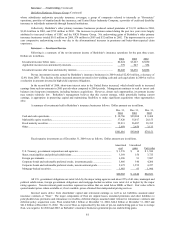
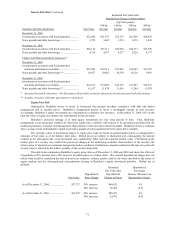
Investment Gains/Losses
Investment gains and losses arise when investments are sold and foreign currency forward contracts are marked-to-
market with a corresponding gain or loss included in earnings. Investment gains and losses also arise in connection with
investments by Berkshire in life settlement contracts. Investment losses can also arise when available-for-sale or held-to-
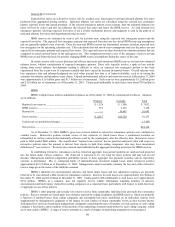
maturity securities are deemed to be other-than-temporarily impaired (“OTTI”). A summary of investment gains and losses
follows. Dollar amounts are in millions.
2004 2003 2002
Investment gains (losses) from -
Sales of investments -
Insurance and other...................................................................................... $1,527 $2,873 $ 961
Finance and financial products .................................................................... 61 338 284
OTTI securities .................................................................................................. (19) (289) (607)
Foreign currency forward contracts ................................................................... 1,839 825 297
Life settlement contracts .................................................................................... (207) — —
Other .................................................................................................................. 288 374 (51)
Investment gains before income taxes and minority interests ................................. 3,489 4,121 884
Income taxes and minority interests............................................................. 1,230 1,392 318
Net investment gains ............................................................................................... $2,259 $2,729 $ 566
Prior to January 1, 2004, Berkshire accounted for investments in life settlement contracts on the cost basis. Therefore,
the cost of the investment included the initial purchase price plus periodic maintenance costs. Beginning in 2004, as a result of
obtaining information which suggested that the SEC believed that a different accounting method should be used, these
investments are being accounted for under FASB Technical Bulletin (“FTB”) 85-4 “Accounting for Purchases of Life
Insurance.” Under FTB 85-4, the carrying value of each contract at purchase and at the end of each reporting period is equal to
the cash surrender value of the contract. Cash paid to purchase these contracts that is in excess of the cash surrender value at the
date of purchase is recognized as a loss immediately and periodic maintenance costs, such as premiums necessary to keep the
underlying policy in force, are charged to earnings immediately. The life insurance benefits are payable to the Company. The
loss during 2004 included $73 million related to life settlement contracts held at December 31, 2003. Despite the accounting loss
recorded for these contracts, management views these contracts to have a current value no less than the cost paid for the policies
plus any subsequent maintenance costs and believes these contracts will produce satisfactory earnings.
Gains and losses from foreign currency contracts arise as the value of the U.S. dollar changes against certain foreign
currencies. Small changes in certain foreign currency exchange rates can produce material changes in the fair value of these
contracts given the large net notional value of Berkshire’ s open contracts ($21.4 billion as of December 31, 2004) and
consequently, may produce exceptional volatility in reported earnings in a given period.