Berkshire Hathaway 2004 Annual Report Download - page 54
Download and view the complete annual report
Please find page 54 of the 2004 Berkshire Hathaway annual report below. You can navigate through the pages in the report by either clicking on the pages listed below, or by using the keyword search tool below to find specific information within the annual report.-
 1
1 -
2
-
3
-
4
-
5
-
6
-
7
-
8
-
9
-
10
-
11
-
12
-
13
-
14
-
15
-
16
-
17
-
18
-
19
-
20
-
21
-
22
-
23
-
24
-
25
-
26
-
27
-
28
-
29
-
30
-
31
-
32
-
33
-
34
-
35
-
36
-
37
-
38
-
39
-
40
-
41
-
42
-
43
-
 44
44 -
 45
45 -
 46
46 -
 47
47 -
 48
48 -
 49
49 -
 50
50 -
 51
51 -
 52
52 -
 53
53 -
 54
54 -
 55
55 -
 56
56 -
 57
57 -
 58
58 -
 59
59 -
 60
60 -
 61
61 -
 62
62 -
 63
63 -
 64
64 -
65
-
66
-
67
-
68
-
69
-
70
-
71
-
72
-
73
-
74
-
75
-
76
-
77
-
78
-
79
-
80
-
81
-
82
 |
 |

53
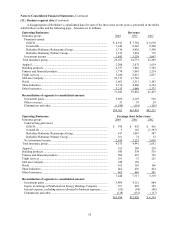
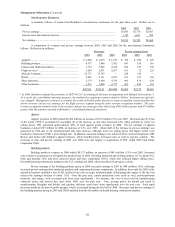
(21) Business segment data (Continued)
Depreciation
Capital expenditures * of tangible assets
Operating Businesses: 2004 2003 2002 2004 2003 2002
Insurance group................................................................. $ 52 $ 55 $ 53 $ 52 $ 63 $ 52
Apparel.............................................................................. 51 71 51 52 51 37
Building products .............................................................. 219 170 158 172 174 152
Finance and financial products.......................................... 296 232 51 183 161 150
Flight services ................................................................... 155 150 241 146 136 127
McLane Company............................................................. 136 51 — 107 59 —
Retail ................................................................................. 126 106 113 56 51 40
Shaw Industries ................................................................. 125 120 196 99 91 91
Other businesses................................................................ 41 47 65 44 43 30
$1,201 $1,002 $ 928 $ 911 $ 829 $ 679
* Excludes capital expenditures which were part of business acquisitions.
Goodwill Identifiable assets
at year-end at year-end
Operating Businesses: 2004 2003 2004 2003
Insurance group:
GEICO.................................................................................. $ 1,370 $ 1,370 $ 15,968 $ 14,088
General Re ............................................................................ 13,518 13,515 37,734 38,831
Berkshire Hathaway Reinsurance and Primary Groups........ 143 143 61,057 56,085
Total insurance group .............................................................. 15,031 15,028 114,759 109,004
Apparel (1) ................................................................................ 54 57 1,582 1,523
Building products .................................................................... 2,159 2,131 2,803 2,593
Finance and financial products ................................................ 911 877 30,086 28,338
Flight services.......................................................................... 1,369 1,369 2,823 2,875
McLane Company (2) ............................................................... 158 145 2,349 2,243
Retail ....................................................................................... 434 434 1,669 1,495
Shaw Industries........................................................................ 1,979 1,996 2,153 1,999
Other businesses (3) .................................................................. 917 911 1,875 1,813
$23,012 $22,948 160,099 151,883
Reconciliation of segments to consolidated amount:
Corporate and other.............................................................. 1,796 1,829
Investments in MidAmerican Energy Holdings Company .. 3,967 3,899
Goodwill .............................................................................. 23,012 22,948
$188,874 $180,559
2004 2003
(1) Excludes other intangible assets not subject to amortization of................ $311 $311
(2) Excludes other intangible assets not subject to amortization of................ 65 65
(3) Excludes other intangible assets not subject to amortization of................ 697 697
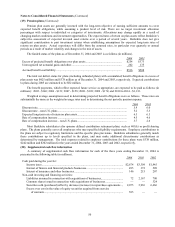
Insurance premiums written by geographic region (based upon the domicile of the insured or reinsured) are
summarized below. Dollars are in millions.
Property/Casualty Life/Health
2004 2003 2002 2004 2003 2002
United States ....................................................... $14,886 $14,701 $14,297 $1,040 $1,031 $1,153
Western Europe................................................... 3,533 3,880 3,870 361 297 411
All other .............................................................. 587 797 800 621 510 335
$19,006 $19,378 $18,967 $2,022 $1,838 $1,899