Berkshire Hathaway 2004 Annual Report Download - page 6
Download and view the complete annual report
Please find page 6 of the 2004 Berkshire Hathaway annual report below. You can navigate through the pages in the report by either clicking on the pages listed below, or by using the keyword search tool below to find specific information within the annual report.-
 1
1 -
 2
2 -
 3
3 -
 4
4 -
 5
5 -
 6
6 -
 7
7 -
 8
8 -
 9
9 -
 10
10 -
 11
11 -
 12
12 -
 13
13 -
 14
14 -
 15
15 -
 16
16 -
 17
17 -
18
-
19
-
20
-
21
-
22
-
23
-
24
-
25
-
26
-
27
-
28
-
29
-
30
-
31
-
32
-
33
-
34
-
35
-
36
-
37
-
38
-
39
-
40
-
41
-
42
-
43
-
44
-
45
-
46
-
47
-
48
-
49
-
50
-
51
-
52
-
53
-
54
-
55
-
56
-
57
-
58
-
59
-
60
-
61
-
62
-
63
-
64
-
65
-
66
-
67
-
68
-
69
-
70
-
71
-
72
-
73
-
74
-
75
-
76
-
77
-
78
-
79
-
80
-
81
-
82
 |
 |

MidAmerican also owns a significant non-utility business, HomeServices of America, the second
largest real estate broker in the country. Unlike our utility operations, this business is highly cyclical, but
nevertheless one we view enthusiastically. We have an exceptional manager, Ron Peltier, who through
both his acquisition and operational skills is building a brokerage powerhouse.
HomeServices participated in $59.8 billion of transactions in 2004, a gain of $11.2 billion from
2003. About 24% of the increase came from six acquisitions made during the year. Through our 17
brokerage firms – all of which retain their local identities – we employ more than 18,000 brokers in 18
states. HomeServices is almost certain to grow substantially in the next decade as we continue to acquire
leading localized operations.
Last year MidAmerican wrote off a major investment in a zinc recovery project that was initiated
in 1998 and became operational in 2002. Large quantities of zinc are present in the brine produced by our
California geothermal operations, and we believed we could profitably extract the metal. For many
months, it appeared that commercially-viable recoveries were imminent. But in mining, just as in oil
exploration, prospects have a way of “teasing” their developers, and every time one problem was solved,
another popped up. In September, we threw in the towel.
Our failure here illustrates the importance of a guideline – stay with simple propositions – that we
usually apply in investments as well as operations. If only one variable is key to a decision, and the
variable has a 90% chance of going your way, the chance for a successful outcome is obviously 90%. But
if ten independent variables need to break favorably for a successful result, and each has a 90% probability
of success, the likelihood of having a winner is only 35%. In our zinc venture, we solved most of the
problems. But one proved intractable, and that was one too many. Since a chain is no stronger than its
weakest link, it makes sense to look for – if you’ ll excuse an oxymoron – mono-linked chains.
A breakdown of MidAmerican’ s results follows. In 2004, the “other” category includes a $72.2
million profit from sale of an Enron receivable that was thrown in when we purchased Northern Natural
two years earlier. Walter, Dave and I, as natives of Omaha, view this unanticipated gain as war reparations
– partial compensation for the loss our city suffered in 1986 when Ken Lay moved Northern to Houston,
after promising to leave the company here. (For details, see Berkshire’ s 2002 annual report.)
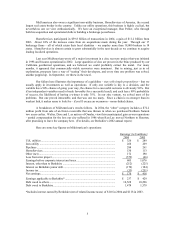
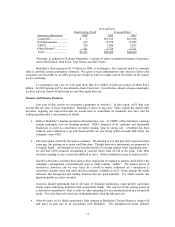
Here are some key figures on MidAmerican’ s operations:
Earnings (in $ millions)
2004 2003
U.K. utilities ....................................................................................................... $ 326 $ 289
Iowa utility ......................................................................................................... 268 269
Pipelines ............................................................................................................. 288 261
HomeServices..................................................................................................... 130 113
Other (net) .......................................................................................................... 172 190
Loss from zinc project........................................................................................ (579) (46)
Earnings before corporate interest and taxes ...................................................... 605 1,076
Interest, other than to Berkshire ......................................................................... (212) (225)
Interest on Berkshire junior debt ........................................................................ (170) (184)
Income tax .......................................................................................................... (53) (251)
Net earnings........................................................................................................ $ 170 $ 416
Earnings applicable to Berkshire*...................................................................... $ 237 $ 429
Debt owed to others............................................................................................ 10,528 10,296
Debt owed to Berkshire...................................................................................... 1,478 1,578
*Includes interest earned by Berkshire (net of related income taxes) of $110 in 2004 and $118 in 2003.
5