Berkshire Hathaway 2004 Annual Report Download - page 63
Download and view the complete annual report
Please find page 63 of the 2004 Berkshire Hathaway annual report below. You can navigate through the pages in the report by either clicking on the pages listed below, or by using the keyword search tool below to find specific information within the annual report.-
 1
1 -
2
-
3
-
4
-
5
-
6
-
7
-
8
-
9
-
10
-
11
-
12
-
13
-
14
-
15
-
16
-
17
-
18
-
19
-
20
-
21
-
22
-
23
-
24
-
25
-
26
-
27
-
28
-
29
-
30
-
31
-
32
-
33
-
34
-
35
-
36
-
37
-
38
-
39
-
40
-
41
-
42
-
43
-
44
-
45
-
46
-
47
-
48
-
49
-
50
-
51
-
52
-
 53
53 -
 54
54 -
 55
55 -
 56
56 -
 57
57 -
 58
58 -
 59
59 -
 60
60 -
 61
61 -
 62
62 -
 63
63 -
 64
64 -
 65
65 -
 66
66 -
 67
67 -
 68
68 -
 69
69 -
 70
70 -
 71
71 -
 72
72 -
 73
73 -
74
-
75
-
76
-
77
-
78
-
79
-
80
-
81
-
82
 |
 |

62
Management’s Discussion (Continued)
Non-Insurance Businesses
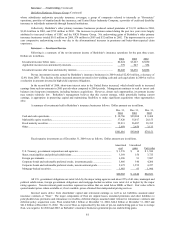
A summary follows of results from Berkshire’ s non-insurance businesses for the past three years. Dollars are in
millions.
2004 2003 2002
Pre-tax earnings .................................................................................................................... $3,065 $2,776 $2,667
Income taxes and minority interests...................................................................................... 1,152 1,031 999
Net earnings .......................................................................................................................... $1,913 $1,745 $1,668
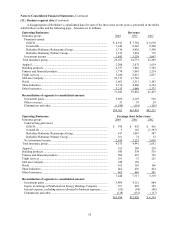
A comparison of revenues and pre-tax earnings between 2004, 2003 and 2002 for the non-insurance businesses
follows. Dollars are in millions.
Revenues Pre-tax earnings (loss)
2004 2003 2002 2004 2003 2002
Apparel........................................................................... $ 2,200 $ 2,075 $ 1,619 $ 325 $ 289 $ 229
Building products........................................................... 4,337 3,846 3,702 643 559 516
Finance and financial products....................................... 3,774 3,045 2,234 584 619 726
Flight services * ............................................................. 3,244 2,431 2,837 191 72 225
McLane Company.......................................................... 23,373 13,743 — 228 150 —
Retail.............................................................................. 2,601 2,311 2,103 163 165 166
Shaw Industries .............................................................. 5,174 4,660 4,334 466 436 424
Other businesses............................................................. 3,213 3,040 2,375 465 486 381
$47,916 $35,151 $19,204 $3,065 $2,776 $2,667
* In 2004, Berkshire adopted the provisions of EITF 00-21(“Accounting for Revenue Arrangements with Multiple Deliverables”).
As a result, for consolidated reporting purposes, the method of recognizing revenue related to NetJets’ fractional aircraft sales
was changed. Management continues to evaluate the results of NetJets under the prior revenue recognition criteria and thus has
shown revenues and pre-tax earnings for the flight services segment using the prior revenue recognition method. The prior
revenue recognition method results in the revenues and pre-tax earnings in this table being $902 million greater and $74 million
greater than the amounts reported in Berkshire’s consolidated financial statements.
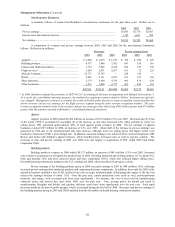
Apparel
Apparel revenues in 2004 totaled $2,200 million, an increase of $125 million (6%) over 2003. Increased sales by Fruit
of the Loom (“FOL”) accounted for essentially all of the increase, as unit sales increased 14%, offset partially by lower net
selling prices. FOL generated approximately 60% of total apparel group revenues in 2004. Pre-tax earnings of apparel
businesses totaled $325 million in 2004, an increase of 12% over 2003. About half of the increase in pre-tax earnings was
generated by FOL due to the aforementioned unit sales increase, although lower net selling prices and higher cotton costs
resulted in a decrease in FOL’ s gross margin rate. In addition, increased earnings were achieved in the footwear businesses (HH
Brown and Justin) and children’ s apparel (Garan), which benefited from increased sales as well as expense controls. The
increases in sales and pre-tax earnings in 2003 over 2002 were due largely to acquisitions of FOL (April 2002) and Garan
(September 2002).
Building products
Building products revenues in 2004 totaled $4,337 million, an increase of $491 million (13%) over 2003. Increased
sales volume was generated in all significant product lines in 2004, including insulation and roofing products (11%), paint (8%),
brick and masonry (4%) and steel connector plates and truss components (38%), which also reflected higher selling prices.
Favorable housing construction markets in the U.S. continued in 2004, which benefited the group as a whole.
Pre-tax earnings of the building products group in 2004 exceeded earnings in 2003 by $84 million (15%), reflecting
increased pre-tax earnings from insulation products and connector plate/truss components. In addition, the results for 2003 of the
insulation business included a loss of $21 million from a fire at a pipe insulation plant. (Eliminating the impact of the fire loss
reduces the earnings increase to about 11%). Over the past year, certain production costs (such as steel, petroleum-based
materials, and energy, such as natural gas) have risen significantly. For instance, the cost of steel (used in manufacturing
connector plates and trusses) has risen about 100% over the past year. Also, average prices for natural gas (used in
manufacturing fiberglass and bricks) and gasoline (delivery costs) have risen significantly over the past year. Such rapid
increases produced declines in profit margins, which accelerated during the last half of 2004. Revenues and pre-tax earnings of
the building products group in 2003 and 2002 benefited from the favorable residential housing construction markets.