Berkshire Hathaway 2004 Annual Report Download - page 13
Download and view the complete annual report
Please find page 13 of the 2004 Berkshire Hathaway annual report below. You can navigate through the pages in the report by either clicking on the pages listed below, or by using the keyword search tool below to find specific information within the annual report.-
 1
1 -
2
-
 3
3 -
 4
4 -
 5
5 -
 6
6 -
 7
7 -
 8
8 -
 9
9 -
 10
10 -
 11
11 -
 12
12 -
 13
13 -
 14
14 -
 15
15 -
 16
16 -
 17
17 -
 18
18 -
 19
19 -
 20
20 -
 21
21 -
 22
22 -
 23
23 -
24
-
25
-
26
-
27
-
28
-
29
-
30
-
31
-
32
-
33
-
34
-
35
-
36
-
37
-
38
-
39
-
40
-
41
-
42
-
43
-
44
-
45
-
46
-
47
-
48
-
49
-
50
-
51
-
52
-
53
-
54
-
55
-
56
-
57
-
58
-
59
-
60
-
61
-
62
-
63
-
64
-
65
-
66
-
67
-
68
-
69
-
70
-
71
-
72
-
73
-
74
-
75
-
76
-
77
-
78
-
79
-
80
-
81
-
82
 |
 |

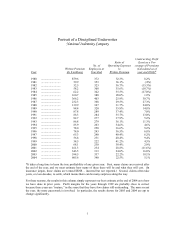
continues to reside in the intensive care unit of Corporate America, having sold less than 135,000
new homes last year, about the same as in 2003. Volume in these years was the lowest since
1962, and it was also only about 40% of annual sales during the years 1995-99. That era,
characterized by irresponsible financing and naïve funders, was a fool’ s paradise for the industry.
Because one major lender after another has fled the field, financing continues to bedevil
manufacturers, retailers and purchasers of manufactured homes. Here Berkshire’ s support has
proven valuable to Clayton. We stand ready to fund whatever makes sense, and last year
Clayton’ s management found much that qualified.
As we explained in our 2003 report, we believe in using borrowed money to support profitable,
interest-bearing receivables. At the beginning of last year, we had borrowed $2 billion to relend to
Clayton (at a one percentage-point markup) and by January 2005 the total was $7.35 billion. Most
of the dollars added were borrowed by us on January 4, 2005, to finance a seasoned portfolio that
Clayton purchased on December 30, 2004 from a bank exiting the business.
We now have two additional portfolio purchases in the works, totaling about $1.6 billion, but it’ s
quite unlikely that we will secure others of any significance. Therefore, Clayton’ s receivables (in
which originations will roughly offset payoffs) will probably hover around $9 billion for some
time and should deliver steady earnings. This pattern will be far different from that of the past, in
which Clayton, like all major players in its industry, “securitized” its receivables, causing earnings
to be front-ended. In the last two years, the securitization market has dried up. The limited funds
available today come only at higher cost and with harsh terms. Had Clayton remained
independent in this period, it would have had mediocre earnings as it struggled with financing.
In April, Clayton completed the acquisition of Oakwood Homes and is now the industry’ s largest
producer and retailer of manufactured homes. We love putting more assets in the hands of Kevin
Clayton, the company’ s CEO. He is a prototype Berkshire manager. Today, Clayton has 11,837
employees, up from 7,136 when we purchased it, and Charlie and I are pleased that Berkshire has
been useful in facilitating this growth.
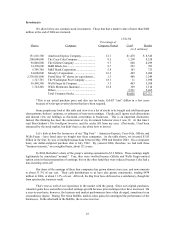
For simplicity’ s sake, we include all of Clayton’ s earnings in this sector, though a sizable portion
of these are derived from areas other than consumer finance.
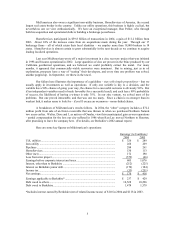
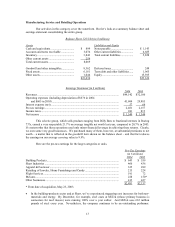
(in $ millions)
Pre-Tax Earnings Interest-Bearing Liabilities
2004 2003 2004 2003
Trading – ordinary income ............................ $ 264 $ 355 $5,751 $7,826
Gen Re Securities ........................................... (44) (99) 5,437* 8,041*
Life and annuity operation.............................. (57) 85 2,467 2,331
Value Capital.................................................. 30 31 N/A N/A
Berkadia ......................................................... 1 101 — 525
Leasing operations.......................................... 92 34 391 482
Manufactured housing finance (Clayton) ....... 220 37** 3,636 2,032
Other............................................................... 78 75 N/A N/A
Income before capital gains............................ 584 619
Trading – capital gains ................................... 1,750 1,215
Total ............................................................... $2,334 $1,834
* Includes all liabilities
** From date of acquisition, August 7, 2003
12