Berkshire Hathaway 2004 Annual Report Download - page 62
Download and view the complete annual report
Please find page 62 of the 2004 Berkshire Hathaway annual report below. You can navigate through the pages in the report by either clicking on the pages listed below, or by using the keyword search tool below to find specific information within the annual report.-
 1
1 -
2
-
3
-
4
-
5
-
6
-
7
-
8
-
9
-
10
-
11
-
12
-
13
-
14
-
15
-
16
-
17
-
18
-
19
-
20
-
21
-
22
-
23
-
24
-
25
-
26
-
27
-
28
-
29
-
30
-
31
-
32
-
33
-
34
-
35
-
36
-
37
-
38
-
39
-
40
-
41
-
42
-
43
-
44
-
45
-
46
-
47
-
48
-
49
-
50
-
51
-
 52
52 -
 53
53 -
 54
54 -
 55
55 -
 56
56 -
 57
57 -
 58
58 -
 59
59 -
 60
60 -
 61
61 -
 62
62 -
 63
63 -
 64
64 -
 65
65 -
 66
66 -
 67
67 -
 68
68 -
 69
69 -
 70
70 -
 71
71 -
 72
72 -
73
-
74
-
75
-
76
-
77
-
78
-
79
-
80
-
81
-
82
 |
 |

61
Insurance — Underwriting (Continued)
Berkshire Hathaway Primary Group (Continued)
whose subsidiaries underwrite specialty insurance coverages; a group of companies referred to internally as “Homestate”
operations, providers of standard multi-line insurance; and Central States Indemnity Company, a provider of credit and disability
insurance to individuals nationwide through financial institutions.
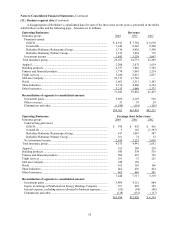
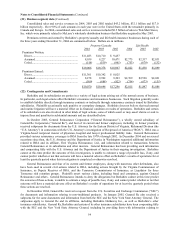
Collectively, Berkshire’ s other primary insurance businesses produced earned premiums of $1,211 million in 2004,
$1,034 million in 2003, and $712 million in 2002. The increases in premiums earned during the past two years were largely
attributed to increased volume of USIC and the NICO Primary Group. Net underwriting gains of Berkshire’ s other primary
insurance businesses totaled $161 million in 2004, $74 million in 2003 and $32 million in 2002. The improvement in year-to-
year comparative underwriting results was due to the aforementioned increases in premiums and better-than-expected claim
experience.
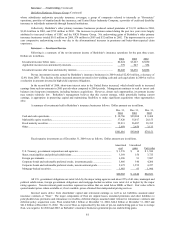
Insurance — Investment Income
Following is a summary of the net investment income of Berkshire’ s insurance operations for the past three years.
Dollars are in millions.
2004 2003 2002
Investment income before taxes........................................................................................ $2,824 $3,223 $3,050
Applicable income taxes and minority interests................................................................ 779 947 954
Investment income after taxes and minority interests ....................................................... $2,045 $2,276 $2,096
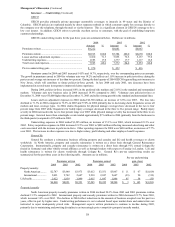
Pre-tax investment income earned by Berkshire’ s insurance businesses in 2004 totaled $2,824 million, a decrease of
12.4% from 2003. The decline reflects increased amounts invested in low-yielding cash and cash equivalents in 2004 as well as
a reduction in amounts invested in high-yield corporate obligations.
In the second half of 2004, short-term interest rates in the United States increased, which should result in increased
earnings from such investments in 2005 periods when compared to 2004 periods. Management continues to seek to invest cash
balances into long-term instruments, including business acquisitions. However, absent such opportunities, investment income
may remain relatively low. Berkshire’ s management believes that this current strategy, while potentially hurting current
earnings, is appropriate in preserving capital and maintaining flexibility to make significant acquisitions when opportunities
arise.
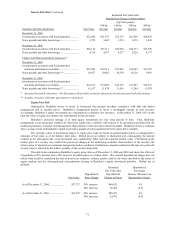
A summary of investments held in Berkshire’ s insurance businesses follows. Dollar amounts are in millions.
Dec. 31,
2004
Dec. 31,
2003
Dec. 31,
2002
Cash and cash equivalents............................................................................................... $ 38,706 $29,908 $ 9,468
Marketable equity securities............................................................................................ 37,420 35,017 28,155
Fixed maturity securities ................................................................................................. 22,831 26,087 38,395
Other................................................................................................................................ 2,059 2,656 3,133
$101,016 $93,668 $79,151
Fixed maturity investments as of December 31, 2004 were as follows. Dollar amounts are in millions.
Amortized
cost
Unrealized
gains
Fair value
U.S. Treasury, government corporations and agencies ................................................... $ 1,576 $ 14 $ 1,590
States, municipalities and political subdivisions ............................................................. 3,569 156 3,725
Foreign governments....................................................................................................... 6,996 91 7,087
Corporate bonds and redeemable preferred stocks, investment grade............................. 3,866 340 4,206
Corporate bonds and redeemable preferred stocks, non-investment grade...................... 2,675 1,552 4,227
Mortgage-backed securities............................................................................................. 1,903 93 1,996
$20,585 $ 2,246 $22,831
All U.S. government obligations are rated AAA by the major rating agencies and about 95% of all state, municipal and
political subdivisions, foreign government obligations and mortgage-backed securities were rated AA or higher by the major
rating agencies. Non-investment grade securities represent securities that are rated below BBB- or Baa3. Fair value reflects
quoted market prices where available or, if not available, prices obtained from independent pricing services.
Invested assets derive from shareholder capital and reinvested earnings as well as net liabilities assumed under
insurance contracts or “float.” The major components of float are unpaid losses, unearned premiums and other liabilities to
policyholders less premiums and reinsurance receivables, deferred charges assumed under retroactive reinsurance contracts and
deferred policy acquisition costs. Float totaled $46.1 billion at December 31, 2004, $44.2 billion at December 31, 2003 and
$41.2 billion at December 31, 2002. The cost of float, as represented by the ratio of pre-tax underwriting gain or loss to average
float, was negative for 2004 and 2003, as Berkshire’ s insurance businesses generated pre-tax underwriting gains.