Berkshire Hathaway 2004 Annual Report Download - page 4
Download and view the complete annual report
Please find page 4 of the 2004 Berkshire Hathaway annual report below. You can navigate through the pages in the report by either clicking on the pages listed below, or by using the keyword search tool below to find specific information within the annual report.-
 1
1 -
 2
2 -
 3
3 -
 4
4 -
 5
5 -
 6
6 -
 7
7 -
 8
8 -
 9
9 -
 10
10 -
 11
11 -
 12
12 -
 13
13 -
 14
14 -
 15
15 -
16
-
17
-
18
-
19
-
20
-
21
-
22
-
23
-
24
-
25
-
26
-
27
-
28
-
29
-
30
-
31
-
32
-
33
-
34
-
35
-
36
-
37
-
38
-
39
-
40
-
41
-
42
-
43
-
44
-
45
-
46
-
47
-
48
-
49
-
50
-
51
-
52
-
53
-
54
-
55
-
56
-
57
-
58
-
59
-
60
-
61
-
62
-
63
-
64
-
65
-
66
-
67
-
68
-
69
-
70
-
71
-
72
-
73
-
74
-
75
-
76
-
77
-
78
-
79
-
80
-
81
-
82
 |
 |

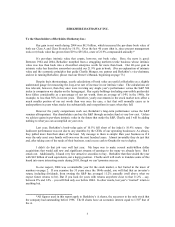
BERKSHIRE HATHAWAY INC.
To the Shareholders of Berkshire Hathaway Inc.:
Our gain in net worth during 2004 was $8.3 billion, which increased the per-share book value of
both our Class A and Class B stock by 10.5%. Over the last 40 years (that is, since present management
took over) book value has grown from $19 to $55,824, a rate of 21.9% compounded annually.*
It’ s per-share intrinsic value that counts, however, not book value. Here, the news is good:
Between 1964 and 2004, Berkshire morphed from a struggling northern textile business whose intrinsic
value was less than book into a diversified enterprise worth far more than book. Our 40-year gain in
intrinsic value has therefore somewhat exceeded our 21.9% gain in book. (For an explanation of intrinsic
value and the economic principles that guide Charlie Munger, my partner and Berkshire’ s vice-chairman,
and me in running Berkshire, please read our Owner’ s Manual, beginning on page 73.)
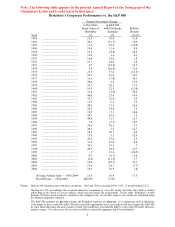
Despite their shortcomings, yearly calculations of book value are useful at Berkshire as a slightly
understated gauge for measuring the long-term rate of increase in our intrinsic value. The calculations are
less relevant, however, than they once were in rating any single year’ s performance versus the S&P 500
index (a comparison we display on the facing page). Our equity holdings (including convertible preferreds)
have fallen considerably as a percentage of our net worth, from an average of 114% in the 1980s, for
example, to less than 50% in recent years. Therefore, yearly movements in the stock market now affect a
much smaller portion of our net worth than was once the case, a fact that will normally cause us to
underperform in years when stocks rise substantially and overperform in years when they fall.
However the yearly comparisons work out, Berkshire’ s long-term performance versus the S&P
remains all-important. Our shareholders can buy the S&P through an index fund at very low cost. Unless
we achieve gains in per-share intrinsic value in the future that outdo the S&P, Charlie and I will be adding
nothing to what you can accomplish on your own.
Last year, Berkshire’ s book-value gain of 10.5% fell short of the index’ s 10.9% return. Our
lackluster performance was not due to any stumbles by the CEOs of our operating businesses: As always,
they pulled more than their share of the load. My message to them is simple: Run your business as if it
were the only asset your family will own over the next hundred years. Almost invariably they do just that
and, after taking care of the needs of their business, send excess cash to Omaha for me to deploy.
I didn’ t do that job very well last year. My hope was to make several multi-billion dollar
acquisitions that would add new and significant streams of earnings to the many we already have. But I
struck out. Additionally, I found very few attractive securities to buy. Berkshire therefore ended the year
with $43 billion of cash equivalents, not a happy position. Charlie and I will work to translate some of this
hoard into more interesting assets during 2005, though we can’ t promise success.
In one respect, 2004 was a remarkable year for the stock market, a fact buried in the maze of
numbers on page 2. If you examine the 35 years since the 1960s ended, you will find that an investor’ s
return, including dividends, from owning the S&P has averaged 11.2% annually (well above what we
expect future returns to be). But if you look for years with returns anywhere close to that 11.2% – say,
between 8% and 14% – you will find only one before 2004. In other words, last year’ s “normal” return is
anything but.
*All figures used in this report apply to Berkshire’ s A shares, the successor to the only stock that
the company had outstanding before 1996. The B shares have an economic interest equal to 1/30th that of
the A.
3