Berkshire Hathaway 2004 Annual Report Download - page 56
Download and view the complete annual report
Please find page 56 of the 2004 Berkshire Hathaway annual report below. You can navigate through the pages in the report by either clicking on the pages listed below, or by using the keyword search tool below to find specific information within the annual report.-
 1
1 -
2
-
3
-
4
-
5
-
6
-
7
-
8
-
9
-
10
-
11
-
12
-
13
-
14
-
15
-
16
-
17
-
18
-
19
-
20
-
21
-
22
-
23
-
24
-
25
-
26
-
27
-
28
-
29
-
30
-
31
-
32
-
33
-
34
-
35
-
36
-
37
-
38
-
39
-
40
-
41
-
42
-
43
-
44
-
45
-
 46
46 -
 47
47 -
 48
48 -
 49
49 -
 50
50 -
 51
51 -
 52
52 -
 53
53 -
 54
54 -
 55
55 -
 56
56 -
 57
57 -
 58
58 -
 59
59 -
 60
60 -
 61
61 -
 62
62 -
 63
63 -
 64
64 -
 65
65 -
 66
66 -
67
-
68
-
69
-
70
-
71
-
72
-
73
-
74
-
75
-
76
-
77
-
78
-
79
-
80
-
81
-
82
 |
 |

55
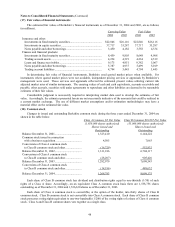
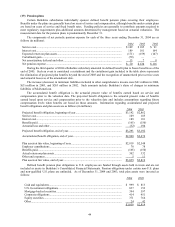
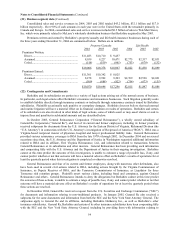
(22) Contingencies and Commitments (Continued)
transactions between General Re or its subsidiaries and other insurers. Berkshire cannot at this time predict the outcome
of these investigations, is unable to estimate a range of possible loss, if any, and cannot predict whether or not that
outcome will have a material adverse effect on Berkshire’ s results of operations for at least the quarterly period when
these investigations are completed or otherwise resolved.
The Liquidator of both FAI Insurance Limited and HIH Insurance Limited has advised two subsidiaries of General
Reinsurance, General Reinsurance Australia (“GRA”) and Kolnische Ruckversicherungs-Gessellschaft (“KR”), of
claims it intends to assert arising from insurance transactions GRA entered into with FAI in May and June 1998. The
Liquidator contends, among other things, that GRA and KR engaged in deceptive conduct that assisted FAI in
improperly accounting for such transactions as reinsurance, and that such deception was a causal factor that led to the
insolvency of HIH. GRA and KR do not know whether the Liquidator will pursue these or other claims, and Berkshire
cannot predict the outcome of any such action and is unable to estimate a range of possible loss, if any, and cannot
predict whether or not that outcome will have a material adverse effect on Berkshire’ s results of operations for at least
the quarterly period when such action, if any, is resolved.
GEICO is a defendant in a number of class action lawsuits related to the use of certain aftermarket parts to
calculate the costs of repairing claimants vehicles. GEICO intends to vigorously defend its position on these claim
settlement procedures. These lawsuits are in various stages of development and Berkshire cannot at this time predict the
outcome of these actions, is unable to estimate a range of possible loss, if any, and cannot predict whether or not that
outcome will have a material adverse effect on Berkshire’ s results of operations for at least the quarterly period when
these actions are resolved.
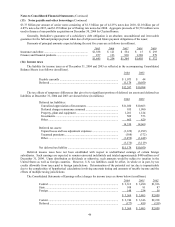
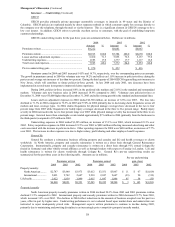
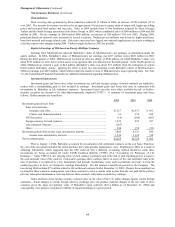
The Company leases certain manufacturing, warehouse, retail and office facilities as well as certain equipment.
Total rent expense for all leases was $422 million, $384 million and $312 million in 2004, 2003 and 2002 respectively.
Minimum rental payments for operating leases having initial or remaining non-cancelable terms in excess of one year
are as follows. Amounts are in millions.
After
2005 2006 2007 2008 2009 2009 Total
$364 $290 $238 $180 $148 $408 $1,628
Several of the Company’ s subsidiaries have made long-term commitments to purchase goods and services used in
their businesses. The most significant of these relate to NetJets’ commitments to purchase up to 340 aircraft through
2014. Commitments under all such subsidiary arrangements are approximately $3.1 billion in 2005, $1.2 billion in
2006, $1.1 billion in 2007, $990 million in 2008, $514 million in 2009 and $867 million after 2009.
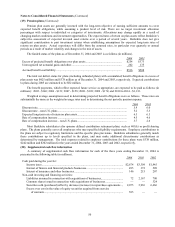
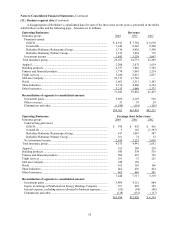
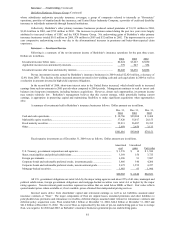
(23) Quarterly data
A summary of revenues and earnings by quarter for each of the last two years is presented in the following table.
This information is unaudited. Dollars are in millions, except per share amounts.
1
st
2
nd
3
rd
4
th
2004 Quarter Quarter Quarter Quarter
Revenues.................................................................................................. $17,184 $17,996 $19,172 $20,030
N
et earnings (1) ......................................................................................... 1,550 1,282 1,137 3,339
Net earnings per equivalent Class A common share................................ 1,008 834 739 2,171
2003
Revenues.................................................................................................. $11,376 $14,396 $18,232 $19,855
N
et earnings (1) ......................................................................................... 1,730 2,229 1,806 2,386
N
et earnings per equivalent Class A common share................................ 1,127 1,452 1,176 1,553
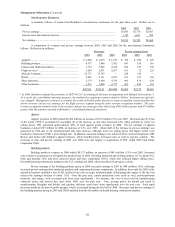
(1) Includes investment gains, which, for any given period have no predictive value, and variations in amount from period to period
have no practical analytical value, particularly in view of the unrealized appreciation now existing in Berkshire’s consolidated
investment portfolio. After-tax investment gains for the periods presented above are as follows:
1
s
t
2
n
d
3
r
d
4
t
h
Quarter Quarter Quarter Quarter
I
nvestment gains – 2004...................................................................................... $415 $(172) $518 $1,498
I
nvestment gains – 2003...................................................................................... 526 905 453 845