Berkshire Hathaway 2004 Annual Report Download - page 32
Download and view the complete annual report
Please find page 32 of the 2004 Berkshire Hathaway annual report below. You can navigate through the pages in the report by either clicking on the pages listed below, or by using the keyword search tool below to find specific information within the annual report.-
 1
1 -
2
-
3
-
4
-
5
-
6
-
7
-
8
-
9
-
10
-
11
-
12
-
13
-
14
-
15
-
16
-
17
-
18
-
19
-
20
-
21
-
 22
22 -
 23
23 -
 24
24 -
 25
25 -
 26
26 -
 27
27 -
 28
28 -
 29
29 -
 30
30 -
 31
31 -
 32
32 -
 33
33 -
 34
34 -
 35
35 -
 36
36 -
 37
37 -
 38
38 -
 39
39 -
 40
40 -
 41
41 -
 42
42 -
43
-
44
-
45
-
46
-
47
-
48
-
49
-
50
-
51
-
52
-
53
-
54
-
55
-
56
-
57
-
58
-
59
-
60
-
61
-
62
-
63
-
64
-
65
-
66
-
67
-
68
-
69
-
70
-
71
-
72
-
73
-
74
-
75
-
76
-
77
-
78
-
79
-
80
-
81
-
82
 |
 |

31
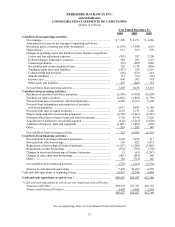
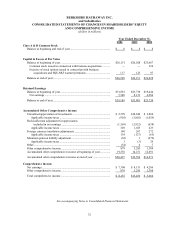
BERKSHIRE HATHAWAY INC.
and Subsidiaries
CONSOLIDATED STATEMENTS OF CASH FLOWS
(dollars in millions)
Year Ended December 31,
2004 2003 2002
Cash flows from operating activities:
Net earnings................................................................................................ $ 7,308 $ 8,151 $ 4,286
Adjustments to reconcile net earnings to operating cash flows:
Investment gains, securities and other investments .................................... (1,636) (3,304) (621)
Depreciation ............................................................................................... 911 829 679
Changes in operating assets and liabilities before business acquisitions:
Losses and loss adjustment expenses....................................................... (383) 397 3,209
Deferred charges reinsurance assumed .................................................... 360 292 (147)
Unearned premiums................................................................................. (52) (585) 1,880
Receivables and certain originated loans ................................................. 102 1,714 (896)
Trading account assets and liabilities....................................................... (367) 530 2,191
Collateral held and provided.................................................................... (86) (273) 218
Annuity liabilities .................................................................................... 131 730 (24)
Income taxes ............................................................................................ 860 505 195
Other assets and liabilities ....................................................................... 257 (548) 165
Net cash flows from operating activities .................................................... 7,405 8,438 11,135
Cash flows from investing activities:
Purchases of securities with fixed maturities.............................................. (5,924) (9,924) (16,288)
Purchases of equity securities..................................................................... (2,032) (1,842) (1,756)
Proceeds from sales of securities with fixed maturities.............................. 4,560 17,165 9,108
Proceeds from redemptions and maturities of securities
with fixed maturities ................................................................................ 5,637 9,847 6,740
Proceeds from sales of equity securities..................................................... 2,610 3,159 1,340
Finance loans and other investments purchased......................................... (6,314) (2,641) (2,281)
Principal collections on finance loans and other investments .................... 2,736 4,140 5,226
Acquisitions of businesses, net of cash acquired........................................ (414) (3,213) (2,620)
Additions of property, plant and equipment ............................................... (1,201) (1,002) (928)
Other........................................................................................................... 563 243 148
Net cash flows from investing activities..................................................... 221 15,932 (1,311)
Cash flows from financing activities:
Proceeds from borrowings of finance businesses....................................... 1,668 2,479 211
Proceeds from other borrowings................................................................. 339 822 1,472
Repayments of borrowings of finance businesses ...................................... (1,267) (2,260) (3,802)
Repayments of other borrowings................................................................ (674) (783) (774)
Changes in short term borrowings of finance businesses ........................... 13 (63) (1,207)
Changes in other short term borrowings..................................................... (401) (642) 380
Other........................................................................................................... 166 (714) 146
Net cash flows from financing activities .................................................... (156) (1,161) (3,574)
Increase in cash and cash equivalents......................................................... 7,470 23,209 6,250
Cash and cash equivalents at beginning of year............................................... 35,957 12,748 6,498
Cash and cash equivalents at end of year *.................................................. $43,427 $35,957 $12,748
* Cash and cash equivalents at end of year are comprised of the following:
Insurance and Other................................................................................... $40,020 $31,262 $10,283
Finance and Financial Products ................................................................ 3,407 4,695 2,465
$43,427 $35,957 $12,748
See accompanying Notes to Consolidated Financial Statements