Berkshire Hathaway 2004 Annual Report Download - page 44
Download and view the complete annual report
Please find page 44 of the 2004 Berkshire Hathaway annual report below. You can navigate through the pages in the report by either clicking on the pages listed below, or by using the keyword search tool below to find specific information within the annual report.-
 1
1 -
2
-
3
-
4
-
5
-
6
-
7
-
8
-
9
-
10
-
11
-
12
-
13
-
14
-
15
-
16
-
17
-
18
-
19
-
20
-
21
-
22
-
23
-
24
-
25
-
26
-
27
-
28
-
29
-
30
-
31
-
32
-
33
-
 34
34 -
 35
35 -
 36
36 -
 37
37 -
 38
38 -
 39
39 -
 40
40 -
 41
41 -
 42
42 -
 43
43 -
 44
44 -
 45
45 -
 46
46 -
 47
47 -
 48
48 -
 49
49 -
 50
50 -
 51
51 -
 52
52 -
 53
53 -
 54
54 -
55
-
56
-
57
-
58
-
59
-
60
-
61
-
62
-
63
-
64
-
65
-
66
-
67
-
68
-
69
-
70
-
71
-
72
-
73
-
74
-
75
-
76
-
77
-
78
-
79
-
80
-
81
-
82
 |
 |

43
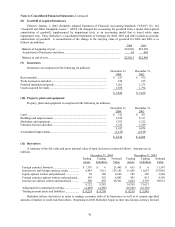
(11) Derivatives (Continued)
contracts with the objective of partially hedging corporate-wide adverse risk from the decline in the value of the U.S.
Dollar. In addition, Berkshire, through its subsidiary General Re Securities (“GRS”) operates as a dealer in various
types of derivative instruments, such as swaps, forwards, futures and options, which are used by clients to manage
economic risks arising from interest rate, foreign exchange rate, or market price movements. In January 2002, GRS
commenced a long-term run-off of its operations. The run-off is expected to occur over a number of years during which
GRS will limit its new business and will unwind its existing asset and liability positions in an orderly manner. General
Re Corporation, the parent of GRS, has guaranteed the obligations of GRS.
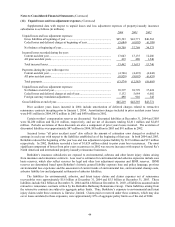
Derivative instruments involve, to varying degrees, elements of market, credit, and liquidity risks. Market risks
may be controlled by taking offsetting positions in either cash instruments or other derivatives. Exposures are managed
on a portfolio basis and monitored continuously.
Master netting agreements are utilized to manage counterparty credit risk, where gains and losses are netted across
all contracts with that counterparty. In addition, counterparty credit limits are established, and credit exposures are
monitored in accordance with these limits. In addition, Berkshire may receive cash or investment grade securities from
counterparties as collateral and, where appropriate, may purchase credit insurance or enter into other transactions to
mitigate exposure if balances exceed specified levels or if credit ratings of counterparties are downgraded below
specified levels. Berkshire may incorporate contractual provisions that allow the unwinding of transactions under
adverse conditions. Likewise, Berkshire may be required to post cash or securities as collateral with counterparties
under similar circumstances. At December 31, 2004, Berkshire held collateral with a fair value of $2,091 million,
including cash of $1,619 million to secure trading account assets. At December 31, 2004, Berkshire posted collateral
with a fair value of approximately $1,681 million (which includes $1,166 million in cash) with counterparties as security
on trading account liabilities. Contractual terms with counterparties often require additional collateral to be posted
immediately in the event of a decline in the financial rating of the counterparty or its guarantor.
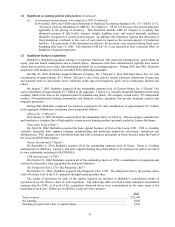
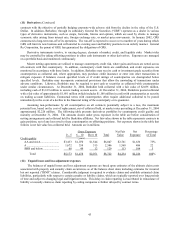
Assuming non-performance by all counterparties on all contracts potentially subject to a loss, the maximum
potential loss, based on the cost of replacement, net of collateral held, at market rates prevailing at December 31, 2004
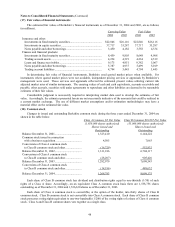
approximated $2,226 million. The following table presents derivatives portfolios by counterparty credit quality and
maturity at December 31, 2004. The amounts shown under gross exposure in the table are before consideration of
netting arrangements and collateral held by Berkshire affiliates. Net fair value shown in the table represents contracts in
gain positions, net of any loss owed to these counterparties on offsetting positions. Net exposure shown in the table that
follows is net fair value less collateral held. Amounts are in millions.
Gross Exposure Net Fair Net Percentage
0 – 5 6 – 10 Over 10 Total Value Exposure of Total
Credit quality (years)
AA and AAA.......................... $3,433 $1,070 $1,544 $6,047 $2,761 $1,636 73%
A............................................. 1,672 359 515 2,546 1,360 486 22
BBB and below ...................... 68 49 12 129 113 104 5
Total $5,173 $1,478 $2,071 $8,722 $4,234 $2,226 100%
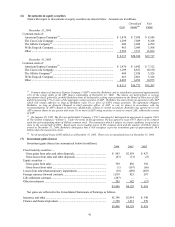
(12) Unpaid losses and loss adjustment expenses
The balances of unpaid losses and loss adjustment expenses are based upon estimates of the ultimate claim costs
associated with property and casualty claim occurrences as of the balance sheet dates including estimates for incurred
but not reported (“IBNR”) claims. Considerable judgment is required to evaluate claims and establish estimated claim
liabilities, particularly with respect to certain casualty or liability claims, which are typically reported over long periods
of time and subject to changing legal and litigation trends. This delay in claim reporting is exacerbated in reinsurance of
liability or casualty claims as claim reporting by ceding companies is further delayed by contract terms.