Berkshire Hathaway 2004 Annual Report Download - page 51
Download and view the complete annual report
Please find page 51 of the 2004 Berkshire Hathaway annual report below. You can navigate through the pages in the report by either clicking on the pages listed below, or by using the keyword search tool below to find specific information within the annual report.-
 1
1 -
2
-
3
-
4
-
5
-
6
-
7
-
8
-
9
-
10
-
11
-
12
-
13
-
14
-
15
-
16
-
17
-
18
-
19
-
20
-
21
-
22
-
23
-
24
-
25
-
26
-
27
-
28
-
29
-
30
-
31
-
32
-
33
-
34
-
35
-
36
-
37
-
38
-
39
-
40
-
 41
41 -
 42
42 -
 43
43 -
 44
44 -
 45
45 -
 46
46 -
 47
47 -
 48
48 -
 49
49 -
 50
50 -
 51
51 -
 52
52 -
 53
53 -
 54
54 -
 55
55 -
 56
56 -
 57
57 -
 58
58 -
 59
59 -
 60
60 -
 61
61 -
62
-
63
-
64
-
65
-
66
-
67
-
68
-
69
-
70
-
71
-
72
-
73
-
74
-
75
-
76
-
77
-
78
-
79
-
80
-
81
-
82
 |
 |

50
Notes to Consolidated Financial Statements (Continued)
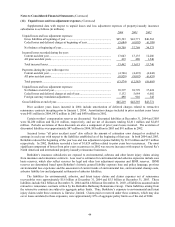
(19) Pension plans (Continued)
Pension plan assets are generally invested with the long-term objective of earning sufficient amounts to cover
expected benefit obligations, while assuming a prudent level of risk. There are no target investment allocation
percentages with respect to individual or categories of investments. Allocations may change rapidly as a result of
changing market conditions and investment opportunities. The expected rates of return on plan assets reflect Berkshire’ s
subjective assessment of expected invested asset returns over a period of several years. Berkshire does not give
significant consideration to past investment returns when establishing assumptions for expected long-term rates of
returns on plan assets. Actual experience will differ from the assumed rates, in particular over quarterly or annual
periods as a result of market volatility and changes in the mix of assets.
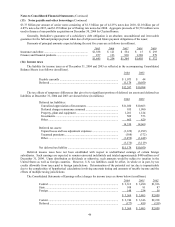
The funded status of the plans as of December 31, 2004 and 2003 is as follows (in millions).
2004 2003
Excess of projected benefit obligations over plan assets.................................................. $254 $373
Unrecognized net actuarial gains and other...................................................................... 262 135
Accrued benefit cost liability............................................................................................ $516 $508
The total net deficit status for plans (including unfunded plans) with accumulated benefit obligations in excess of
plan assets was $425 million and $378 million as of December 31, 2004 and 2003, respectively. Expected contributions
to plans during 2005 are estimated to be $82 million.
The benefit payments, which reflect expected future service as appropriate, are expected to be paid as follows (in
millions): 2005 - $146; 2006 - $151; 2007 - $158; 2008 - $169; 2009 - $174; and 2010 to 2014 - $1,133.
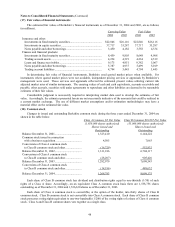
Weighted average assumptions used in determining projected benefit obligations were as follows. These rates are
substantially the same as the weighted average rates used in determining the net periodic pension expense.
2004 2003
Discount rate............................................................................................................................ 5.9 6.0
Discount rate – non-U.S. plans................................................................................................ 5.2 5.3
Expected long-term rate of return on plan assets..................................................................... 6.5 6.5
Rate of compensation increase ................................................................................................ 4.5 4.6
Rate of compensation increase – non-U.S. plans..................................................................... 3.7 2.6
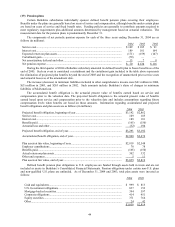
Most Berkshire subsidiaries also sponsor defined contribution retirement plans, such as 401(k) or profit sharing
plans. The plans generally cover all employees who meet specified eligibility requirements. Employee contributions to
the plans are subject to regulatory limitations and the specific plan provisions. Berkshire subsidiaries generally match
these contributions up to levels specified in the plans, and may make additional discretionary contributions as
determined by management. The total expenses related to employer contributions for these plans were $338 million,
$242 million and $202 million for the years ended December 31, 2004, 2003 and 2002, respectively.
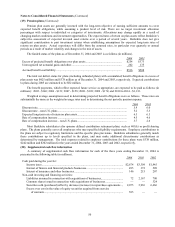
(20) Supplemental cash flow information
A summary of supplemental cash flow information for each of the three years ending December 31, 2004 is
presented in the following table (in millions).
2004 2003 2002
Cash paid during the year for:
Income taxes................................................................................................................. $2,674 $3,309 $1,945
Interest of finance and financial products businesses................................................... 495 372 509
Interest of insurance and other businesses.................................................................... 146 215 207
Non-cash investing and financing activities:
Liabilities assumed in connection with acquisitions of businesses............................... 72 2,167 700
Common shares issued in connection with acquisitions of businesses......................... — — 324
Securities sold (purchased) offset by decrease (increase) in repurchase agreements ... 2,075 5,936 6,666
Excess over cost in the value of equity securities acquired from exercise
of warrants.............................................................................................................. 585 — —