Berkshire Hathaway 2004 Annual Report Download - page 53
Download and view the complete annual report
Please find page 53 of the 2004 Berkshire Hathaway annual report below. You can navigate through the pages in the report by either clicking on the pages listed below, or by using the keyword search tool below to find specific information within the annual report.-
 1
1 -
2
-
3
-
4
-
5
-
6
-
7
-
8
-
9
-
10
-
11
-
12
-
13
-
14
-
15
-
16
-
17
-
18
-
19
-
20
-
21
-
22
-
23
-
24
-
25
-
26
-
27
-
28
-
29
-
30
-
31
-
32
-
33
-
34
-
35
-
36
-
37
-
38
-
39
-
40
-
41
-
42
-
 43
43 -
 44
44 -
 45
45 -
 46
46 -
 47
47 -
 48
48 -
 49
49 -
 50
50 -
 51
51 -
 52
52 -
 53
53 -
 54
54 -
 55
55 -
 56
56 -
 57
57 -
 58
58 -
 59
59 -
 60
60 -
 61
61 -
 62
62 -
 63
63 -
64
-
65
-
66
-
67
-
68
-
69
-
70
-
71
-
72
-
73
-
74
-
75
-
76
-
77
-
78
-
79
-
80
-
81
-
82
 |
 |

52
Notes to Consolidated Financial Statements (Continued)
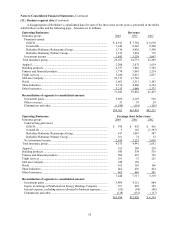
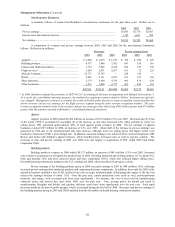
(21) Business segment data (Continued)
A disaggregation of Berkshire’ s consolidated data for each of the three most recent years is presented in the tables
which follow on this and the following page. Amounts are in millions.
Operating Businesses: Revenues
Insurance group: 2004 2003 2002
Premiums earned:
GEICO.................................................................................................... $ 8,915 $ 7,784 $ 6,670
General Re.............................................................................................. 7,245 8,245 8,500
Berkshire Hathaway Reinsurance Group................................................ 3,714 4,430 3,300
Berkshire Hathaway Primary Group....................................................... 1,211 1,034 712
Investment income .................................................................................... 2,842 3,238 3,067
Total insurance group................................................................................... 23,927 24,731 22,249
Apparel......................................................................................................... 2,200 2,075 1,619
Building products ......................................................................................... 4,337 3,846 3,702
Finance and financial products..................................................................... 3,774 3,045 2,234
Flight services .............................................................................................. 3,244 2,431 2,837
McLane Company........................................................................................ 23,373 13,743 —
Retail ............................................................................................................ 2,601 2,311 2,103
Shaw Industries ............................................................................................ 5,174 4,660 4,334
Other businesses........................................................................................... 3,213 3,040 2,375
71,843 59,882 41,453
Reconciliation of segments to consolidated amount:
Investment gains........................................................................................ 3,496 4,129 918
Other revenues........................................................................................... 53 39 29
Eliminations and other............................................................................... (1,010) (191) (165)
$74,382 $63,859 $42,235
Operating Businesses: Earnings (loss) before taxes
Insurance group: 2004 2003 2002
Underwriting gain (loss):
GEICO.................................................................................................... $ 970 $ 452 $ 416
General Re.............................................................................................. 3 145 (1,393)
Berkshire Hathaway Reinsurance Group................................................ 417 1,047 547
Berkshire Hathaway Primary Group....................................................... 161 74 32
Net investment income .............................................................................. 2,824 3,223 3,050
Total insurance group................................................................................... 4,375 4,941 2,652
Apparel......................................................................................................... 325 289 229
Building products ......................................................................................... 643 559 516
Finance and financial products..................................................................... 584 619 726
Flight services .............................................................................................. 191 72 225
McLane Company........................................................................................ 228 150 —
Retail ............................................................................................................ 163 165 166
Shaw Industries ............................................................................................ 466 436 424
Other businesses........................................................................................... 465 486 381
7,440 7,717 5,319
Reconciliation of segments to consolidated amount:
Investment gains........................................................................................ 3,489 4,121 884
Equity in earnings of MidAmerican Energy Holdings Company.............. 237 429 359
Interest expense, excluding interest allocated to business segments ......... (92) (94) (86)
Eliminations and other............................................................................... (138) (153) (117)
$10,936 $12,020 $ 6,359