Berkshire Hathaway 2004 Annual Report Download - page 64
Download and view the complete annual report
Please find page 64 of the 2004 Berkshire Hathaway annual report below. You can navigate through the pages in the report by either clicking on the pages listed below, or by using the keyword search tool below to find specific information within the annual report.-
 1
1 -
2
-
3
-
4
-
5
-
6
-
7
-
8
-
9
-
10
-
11
-
12
-
13
-
14
-
15
-
16
-
17
-
18
-
19
-
20
-
21
-
22
-
23
-
24
-
25
-
26
-
27
-
28
-
29
-
30
-
31
-
32
-
33
-
34
-
35
-
36
-
37
-
38
-
39
-
40
-
41
-
42
-
43
-
44
-
45
-
46
-
47
-
48
-
49
-
50
-
51
-
52
-
53
-
 54
54 -
 55
55 -
 56
56 -
 57
57 -
 58
58 -
 59
59 -
 60
60 -
 61
61 -
 62
62 -
 63
63 -
 64
64 -
 65
65 -
 66
66 -
 67
67 -
 68
68 -
 69
69 -
 70
70 -
 71
71 -
 72
72 -
 73
73 -
 74
74 -
75
-
76
-
77
-
78
-
79
-
80
-
81
-
82
 |
 |

63
Non-Insurance Businesses (Continued)
Finance and financial products
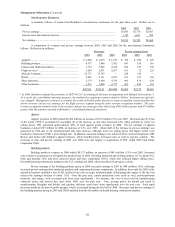
Revenues generated by the finance and financial products group in 2004 totaled $3,774 million, an increase of 24%
over 2003. Revenues in 2004 include Clayton Homes for the full year. Clayton was acquired by Berkshire on August 7, 2003
and its results are included in Berkshire’ s consolidated financial statements beginning as of that date. See Note 2 to the
Consolidated Financial Statements for information regarding this acquisition. Clayton generated total revenues of approximately
$2,024 million in 2004 compared to $512 million in 2003.
Excluding Clayton, finance revenues in 2004 declined $783 million from 2003. Life insurance annuity premiums of
$700 million were earned in the last half of 2003 from a few sizable transactions. Annuity premiums generated in 2004 were
nominal. The comparative declines in 2004 revenues also reflect lower interest income, resulting from lower amounts of
invested assets associated with leveraged investing activities, including reduced interest from Berkadia’ s loan to FINOVA, and
higher proportions of low-yielding short-term investments to total invested assets. Somewhat offsetting the decline was the fact
that Value Capital was consolidated during the first half of 2004. See Note 15 to the Consolidated Financial Statements for
additional information regarding Value Capital.
Pre-tax earnings from finance and financial products businesses, excluding investment gains/losses, in 2004 were $584
million, a decrease of $35 million (6%) from 2003. Pre-tax earnings reflect the inclusion of Clayton for the full year of 2004 as
well as much improved earnings from leasing businesses (CORT and XTRA). In 2004, the leasing businesses generated pre-tax
earnings of $92 million compared to $34 million in 2003. In addition, the net loss from the run-off of General Re’ s finance
business was reduced by $55 million in 2004.
Pre-tax earnings from leveraged investing activities declined approximately $163 million in 2004 as a result of
comparatively lower amounts of invested assets. In addition, pre-tax earnings for 2004 of the life/annuity insurance business
declined approximately $142 million as a result of higher allocations of investments in cash and cash equivalents, a significant
reduction in the early redemption of fixed-income securities purchased at a discount and adverse changes in mortality
assumptions.
Flight services
Flight service revenues increased $813 million (33%) over 2003. Over 90% of the revenue increase resulted from the
NetJets business where flight operations revenue increased just under $400 million and revenues from aircraft sales increased
about $360 million. The increase in flight operations revenue was primarily due to higher usage, a larger percentage of hours
being on larger aircraft and a slight rate increase. Sales of fractional aircraft increased due to an approximately 10% increase in
aircraft sold and a higher percentage of sales being large cabin aircraft which carry a higher sales price. In 2004, revenues from
FlightSafety increased about $57 million (10% over the prior year). Increased revenues from simulator sales represent about
65% of the increase with increased training revenues accounting for the remainder. Increased training revenues in 2004 were
attributed to a 13% increase in simulator usage, primarily from corporate aviation and regional airline customers, offset by
reduced revenues from government customers.
Pre-tax earnings of flight services businesses totaled $191 million in 2004, an increase of $119 million as compared to
2003. About half of this increase is due to reduced write downs of certain simulators and aircraft inventory. During 2003, such
write downs were about $69 million and during 2004 they were about $12 million. Pre-tax earnings from FlightSafety’ s training
business, excluding asset write downs, increased about $33 million due to the aforementioned revenue increases. Pre-tax
earnings from NetJets’ flight operations business, excluding asset write downs, improved by about $25 million.
Operating results of the flight services business have improved gradually since 2003. These businesses were adversely
affected by the attack on the World Trade Center and the deterioration in the U.S. economy that followed. Revenues and pre-tax
earnings of this segment in 2003 declined in comparison with 2002.
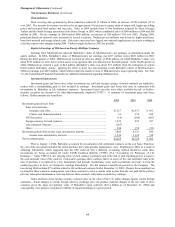
McLane Company
On May 23, 2003, Berkshire acquired McLane Company, Inc., a distributor of grocery and food products to retailers,
convenience stores and restaurants. See Note 2 to the Consolidated Financial Statements for additional information regarding the
McLane acquisition. Results of McLane’ s business operations are included in Berkshire’ s consolidated results beginning on that
date. McLane’ s revenues in 2004 totaled $23.4 billion and for the full year 2003 totaled about $22 billion. Pre-tax earnings
totaled $228 million in 2004 and $225 million for the full year 2003. The comparative year-to-date increases in sales reflect the
addition of new customers since Berkshire’ s acquisition and growth in the food service business. In 2004, approximately 33% of
McLane’ s annual revenues derived from sales to Wal-Mart Stores, Inc. McLane’ s business is marked by high sales volume and
very thin profit margins.
Retail
Berkshire’ s principal retail operations consist of home furnishings and jewelry retailers. Total revenues attributed to
retail operations were $2.60 billion in 2004 and $2.31 billion in 2003. Same store sales in 2004 increased 2.4% from 2003. Pre-
tax earnings of the retail group totaled $163 million in 2004 compared to $165 million in 2003. The increase in sales was
substantially offset by higher costs associated with new home furnishings stores, including increased salaries and benefits,
depreciation, and distribution costs.