Berkshire Hathaway 2004 Annual Report Download - page 14
Download and view the complete annual report
Please find page 14 of the 2004 Berkshire Hathaway annual report below. You can navigate through the pages in the report by either clicking on the pages listed below, or by using the keyword search tool below to find specific information within the annual report.-
 1
1 -
2
-
3
-
 4
4 -
 5
5 -
 6
6 -
 7
7 -
 8
8 -
 9
9 -
 10
10 -
 11
11 -
 12
12 -
 13
13 -
 14
14 -
 15
15 -
 16
16 -
 17
17 -
 18
18 -
 19
19 -
 20
20 -
 21
21 -
 22
22 -
 23
23 -
 24
24 -
25
-
26
-
27
-
28
-
29
-
30
-
31
-
32
-
33
-
34
-
35
-
36
-
37
-
38
-
39
-
40
-
41
-
42
-
43
-
44
-
45
-
46
-
47
-
48
-
49
-
50
-
51
-
52
-
53
-
54
-
55
-
56
-
57
-
58
-
59
-
60
-
61
-
62
-
63
-
64
-
65
-
66
-
67
-
68
-
69
-
70
-
71
-
72
-
73
-
74
-
75
-
76
-
77
-
78
-
79
-
80
-
81
-
82
 |
 |

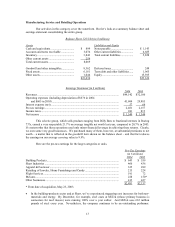
Manufacturing, Service and Retailing Operations
Our activities in this category cover the waterfront. But let’ s look at a summary balance sheet and
earnings statement consolidating the entire group.
Balance Sheet 12/31/04 (in $ millions)
Assets Liabilities and Equity
Cash and equivalents ................................. $ 899 Notes payable ............................... $ 1,143
Accounts and notes receivable .................. 3,074 Other current liabilities................. 4,685
Inventory ................................................... 3,842 Total current liabilities ................. 5,828
Other current assets ................................... 254
Total current assets.................................... 8,069
Goodwill and other intangibles.................. 8,362 Deferred taxes............................... 248
Fixed assets................................................ 6,161 Term debt and other liabilities...... 1,965
Other assets................................................ 1,044 Equity ........................................... 15,595
$23,636 $23,636
Earnings Statement (in $ millions)
2004 2003
Revenues ................................................................................................................. $44,142 $32,106
Operating expenses (including depreciation of $676 in 2004
and $605 in 2003)............................................................................................. 41,604 29,885
Interest expense (net)............................................................................................... 57 64
Pre-tax earnings....................................................................................................... 2,481 2,157
Income taxes............................................................................................................ 941 813
Net income .............................................................................................................. $ 1,540 $ 1,344
This eclectic group, which sells products ranging from Dilly Bars to fractional interests in Boeing
737s, earned a very respectable 21.7% on average tangible net worth last year, compared to 20.7% in 2003.
It’ s noteworthy that these operations used only minor financial leverage in achieving these returns. Clearly,
we own some very good businesses. We purchased many of them, however, at substantial premiums to net
worth – a matter that is reflected in the goodwill item shown on the balance sheet – and that fact reduces
the earnings on our average carrying value to 9.9%.
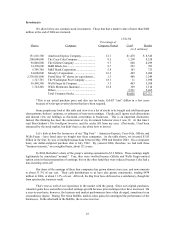
Here are the pre-tax earnings for the larger categories or units.
Pre-Tax Earnings
(in $ millions)
2004 2003
Building Products .................................................................................................... $ 643 $ 559
Shaw Industries ....................................................................................................... 466 436
Apparel & Footwear................................................................................................ 325 289
Retailing of Jewelry, Home Furnishings and Candy ............................................... 215 224
Flight Services......................................................................................................... 191 72
McLane.................................................................................................................... 228 150*
Other businesses ...................................................................................................... 413 427
$2,481 $2,157
* From date of acquisition, May 23, 2003.
• In the building-products sector and at Shaw, we’ ve experienced staggering cost increases for both raw-
materials and energy. By December, for example, steel costs at MiTek (whose primary business is
connectors for roof trusses) were running 100% over a year earlier. And MiTek uses 665 million
pounds of steel every year. Nevertheless, the company continues to be an outstanding performer.
13