Berkshire Hathaway 2003 Annual Report Download - page 68
Download and view the complete annual report
Please find page 68 of the 2003 Berkshire Hathaway annual report below. You can navigate through the pages in the report by either clicking on the pages listed below, or by using the keyword search tool below to find specific information within the annual report.-
 1
1 -
2
-
3
-
4
-
5
-
6
-
7
-
8
-
9
-
10
-
11
-
12
-
13
-
14
-
15
-
16
-
17
-
18
-
19
-
20
-
21
-
22
-
23
-
24
-
25
-
26
-
27
-
28
-
29
-
30
-
31
-
32
-
33
-
34
-
35
-
36
-
37
-
38
-
39
-
40
-
41
-
42
-
43
-
44
-
45
-
46
-
47
-
48
-
49
-
50
-
51
-
52
-
53
-
54
-
55
-
56
-
57
-
 58
58 -
 59
59 -
 60
60 -
 61
61 -
 62
62 -
 63
63 -
 64
64 -
 65
65 -
 66
66 -
 67
67 -
 68
68 -
 69
69 -
 70
70 -
 71
71 -
 72
72 -
 73
73 -
 74
74 -
 75
75 -
 76
76 -
 77
77 -
 78
78
 |
 |

67
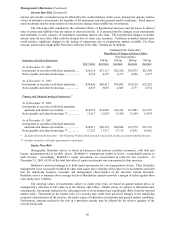
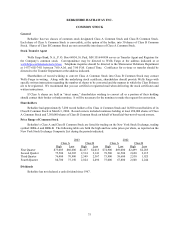
Equity Price Risk (Continued)
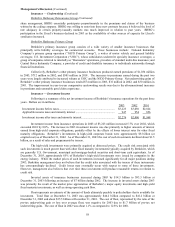
The table below summarizes Berkshire’ s equity price risks as of December 31, 2003 and 2002 and shows
the effects of a hypothetical 30% increase and a 30% decrease in market prices as of those dates. The selected
hypothetical change does not reflect what could be considered the best or worst case scenarios. Indeed, results
could be far worse due both to the nature of equity markets and the aforementioned concentrations existing in
Berkshire’ s equity investment portfolio. Dollars are in millions.
Estimated Hypothetical
Fair Value after Percentage
Hypothetical Hypothetical Increase (Decrease) in
Fair Value Price Change Change in Prices Shareholders’ Equity
As of December 31, 2003................. $35,287 30% increase $45,873 8.9
30% decrease 24,701 (8.9)
As of December 31, 2002................. $28,363 30% increase $36,872 8.6
30% decrease 19,854 (8.6)
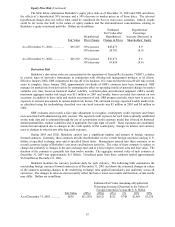
Derivatives Risk
Berkshire’ s derivatives risks are concentrated in the operations of General Re Securities (“GRS”), a dealer
in various types of derivative instruments in conjunction with offering risk management products to its clients.
Effective January 2002, GRS commenced the run-off of its business. It is expected that the run-off will take several
years to complete. Since January 2002, approximately two-thirds of GRS’ s contracts have been terminated. GRS
manages its market risk from derivatives by estimating the effect on operating results of potential changes in market
variables over time, based on historical market volatility, correlation data and informed judgment. GRS’ s weekly
maximum aggregate market risk target was $15 million in 2003 and weekly losses exceeded that amount on two
occasions. In addition to these daily and weekly assessments of risk, GRS prepares periodic stress tests to assess its
exposure to extreme movements in various market risk factors. The estimated average expected weekly market risk,
as calculated using the methodology described over one week intervals was $5 million in 2003 and $4 million in
2002.
GRS evaluates and records a fair-value adjustment to recognize counterparty credit exposure and future
costs associated with administering each contract. The expected credit exposure for each trade is initially established
on the trade date and is estimated through the use of a proprietary credit exposure model that is based on historical
default probabilities, market volatilities and, if applicable, the legal right of setoff. These exposures are continually
monitored and adjusted due to changes in the credit quality of the counterparty, changes in interest and currency
rates or changes in other factors affecting credit exposure.
During 2003 and 2002, Berkshire entered into a significant number and amount of foreign currency
forward contracts. Generally, these contracts provide that Berkshire receive certain foreign currencies and pay U.S.
dollars at specified exchange rates and at specified future dates. Management entered into these contracts as an
overall economic hedge of Berkshire’ s net assets and business activities. The value of these contracts is subject to
change due primarily to changes in the spot exchange rates and to a lesser degree, interest rates and time value. The
duration of the contracts is generally less than twelve months. The aggregate notional value of such contracts at
December 31, 2003 was approximately $11 billion. Unrealized gains from these contracts totaled approximately
$630 million at December 31, 2003.
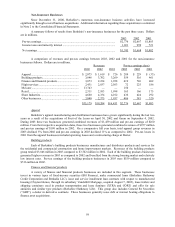
Berkshire monitors the currency positions daily for each currency. The following table summarizes the
outstanding foreign currency forward contracts as of December 31, 2003 and shows the estimated changes in values
of the contracts assuming changes in the underlying exchange rates applied immediately and uniformly across all
currencies. The changes in value do not necessarily reflect the best or worst case results and therefore, actual results
may differ. Dollars are in millions.
Estimated Fair Value Assuming a Hypothetical
Percentage Increase (Decrease) in the Value of
Foreign Currencies Versus the U.S. Dollar
Fair Value (20%) (10%) (1%) 1% 10% 20%
As of December 31, 2003............. $630 $(1,583) $(512) $512 $748 $1,865 $3,230