Berkshire Hathaway 2003 Annual Report Download - page 12
Download and view the complete annual report
Please find page 12 of the 2003 Berkshire Hathaway annual report below. You can navigate through the pages in the report by either clicking on the pages listed below, or by using the keyword search tool below to find specific information within the annual report.-
 1
1 -
 2
2 -
 3
3 -
 4
4 -
 5
5 -
 6
6 -
 7
7 -
 8
8 -
 9
9 -
 10
10 -
 11
11 -
 12
12 -
 13
13 -
 14
14 -
 15
15 -
 16
16 -
 17
17 -
 18
18 -
 19
19 -
 20
20 -
 21
21 -
 22
22 -
23
-
24
-
25
-
26
-
27
-
28
-
29
-
30
-
31
-
32
-
33
-
34
-
35
-
36
-
37
-
38
-
39
-
40
-
41
-
42
-
43
-
44
-
45
-
46
-
47
-
48
-
49
-
50
-
51
-
52
-
53
-
54
-
55
-
56
-
57
-
58
-
59
-
60
-
61
-
62
-
63
-
64
-
65
-
66
-
67
-
68
-
69
-
70
-
71
-
72
-
73
-
74
-
75
-
76
-
77
-
78
 |
 |

11
sure to remember that the company should be viewed as an unfolding movie, not as a still photograph.
Those who focused in the past on only the snapshot of the day sometimes reached erroneous conclusions.
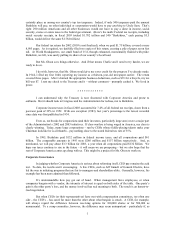
Insurance
Let’ s start with insurance – since that’ s where the money is.
The fountain of funds we enjoy in our insurance operations comes from “float,” which is money
that doesn’ t belong to us but that we temporarily hold. Most of our float arises because (1) premiums are
paid upfront though the service we provide – insurance protection – is delivered over a period that usually
covers a year and; (2) loss events that occur today do not always result in our immediately paying claims,
since it sometimes takes years for losses to be reported (think asbestos), negotiated and settled.
Float is wonderful – if it doesn’ t come at a high price. The cost of float is determined by
underwriting results, meaning how losses and expenses paid compare with premiums received. The
property-casualty industry as a whole regularly operates at a substantial underwriting loss, and therefore
often has a cost of float that is unattractive.
Overall, our results have been good. True, we’ ve had five terrible years in which float cost us
more than 10%. But in 18 of the 37 years Berkshire has been in the insurance business, we have operated
at an underwriting profit, meaning we were actually paid for holding money. And the quantity of this
cheap money has grown far beyond what I dreamed it could when we entered the business in 1967.
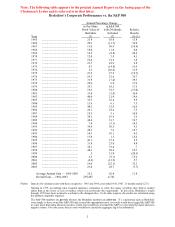
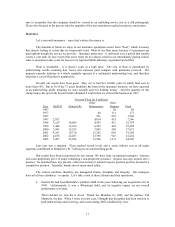
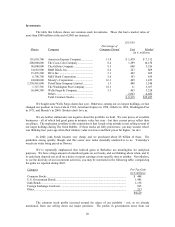
Yearend Float (in $ millions)
Other Other
Year GEICO General Re Reinsurance Primary Total
1967 20 20
1977 40 131 171
1987 701 807 1,508
1997 2,917 4,014 455 7,386
1998 3,125 14,909 4,305 415 22,754
1999 3,444 15,166 6,285 403 25,298
2000 3,943 15,525 7,805 598 27,871
2001 4,251 19,310 11,262 685 35,508
2002 4,678 22,207 13,396 943 41,224
2003 5,287 23,654 13,948 1,331 44,220
Last year was a standout. Float reached record levels and it came without cost as all major
segments contributed to Berkshire’ s $1.7 billion pre-tax underwriting profit.
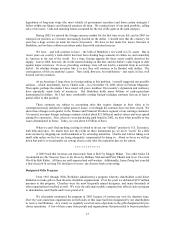
Our results have been exceptional for one reason: We have truly exceptional managers. Insurers
sell a non-proprietary piece of paper containing a non-proprietary promise. Anyone can copy anyone else’ s
product. No installed base, key patents, critical real estate or natural resource position protects an insurer’ s
competitive position. Typically, brands do not mean much either.
The critical variables, therefore, are managerial brains, discipline and integrity. Our managers
have all of these attributes – in spades. Let’ s take a look at these all-stars and their operations.
• General Re had been Berkshire’ s problem child in the years following our acquisition of it in
1998. Unfortunately, it was a 400-pound child, and its negative impact on our overall
performance was large.
That’ s behind us: Gen Re is fixed. Thank Joe Brandon, its CEO, and his partner, Tad
Montross, for that. When I wrote you last year, I thought that discipline had been restored to
both underwriting and reserving, and events during 2003 solidified my view.