Berkshire Hathaway 2003 Annual Report Download - page 52
Download and view the complete annual report
Please find page 52 of the 2003 Berkshire Hathaway annual report below. You can navigate through the pages in the report by either clicking on the pages listed below, or by using the keyword search tool below to find specific information within the annual report.-
 1
1 -
2
-
3
-
4
-
5
-
6
-
7
-
8
-
9
-
10
-
11
-
12
-
13
-
14
-
15
-
16
-
17
-
18
-
19
-
20
-
21
-
22
-
23
-
24
-
25
-
26
-
27
-
28
-
29
-
30
-
31
-
32
-
33
-
34
-
35
-
36
-
37
-
38
-
39
-
40
-
41
-
 42
42 -
 43
43 -
 44
44 -
 45
45 -
 46
46 -
 47
47 -
 48
48 -
 49
49 -
 50
50 -
 51
51 -
 52
52 -
 53
53 -
 54
54 -
 55
55 -
 56
56 -
 57
57 -
 58
58 -
 59
59 -
 60
60 -
 61
61 -
 62
62 -
63
-
64
-
65
-
66
-
67
-
68
-
69
-
70
-
71
-
72
-
73
-
74
-
75
-
76
-
77
-
78
 |
 |

51
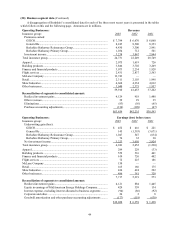
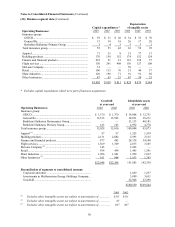
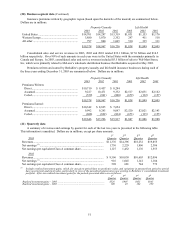
(20) Business segment data (Continued)
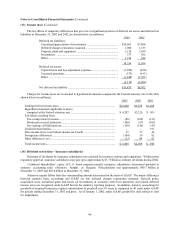
Insurance premiums written by geographic region (based upon the domicile of the insured) are summarized below.
Dollars are in millions.
Property/Casualty Life/Health
2003 2002 2001 2003 2002 2001
United States ....................................................... $14,701 $14,297 $13,319 $1,031 $1,153 $1,176
Western Europe................................................... 3,880 3,870 2,352 297 411 518
All other .............................................................. 797 800 1,065 510 335 311
$19,378 $18,967 $16,736 $1,838 $1,899 $2,005
Consolidated sales and service revenues in 2003, 2002 and 2001 totaled $32.1 billion, $17.0 billion and $14.5
billion respectively. Over 90% of such amounts in each year were in the United States with the remainder primarily in
Canada and Europe. In 2003, consolidated sales and service revenues included $5.5 billion of sales to Wal-Mart Stores,
Inc. which were primarily related to McLane’ s wholesale distribution business that Berkshire acquired in May 2003.
Premiums written and earned by Berkshire’ s property/casualty and life/health insurance businesses during each of
the three years ending December 31, 2003 are summarized below. Dollars are in millions.
Property/Casualty Life/Health
2003 2002 2001 2003 2002 2001
Premiums Written:
Direct................................................................ $10,710 $ 9,457 $ 8,294
Assumed........................................................... 9,227 10,471 9,332 $2,517 $2,031 $2,162
Ceded................................................................ (559) (961) (890) (679) (132) (157)
$19,378 $18,967 $16,736 $1,838 $1,899 $2,005
Premiums Earned:
Direct................................................................ $10,342 $ 8,825 $ 7,654
Assumed........................................................... 9,992 9,293 9,097 $2,520 $2,021 $2,143
Ceded................................................................ (688) (822) (834) (673) (135) (155)
$19,646 $17,296 $15,917 $1,847 $1,886 $1,988
(21) Quarterly data
A summary of revenues and earnings by quarter for each of the last two years is presented in the following table.
This information is unaudited. Dollars are in millions, except per share amounts.
1st 2nd 3rd 4th
2003 Quarter Quarter Quarter Quarter
Revenues.................................................................................................. $11,376 $14,396 $18,232 $19,855
Net earnings (1) ......................................................................................... 1,730 2,229 1,806 2,386
Net earnings per equivalent Class A common share................................ 1,127 1,452 1,176 1,553
2002
Revenues.................................................................................................. $ 9,506 $10,030 $10,603 $12,096
Net earnings (1) ......................................................................................... 916 1,045 1,141 1,184
Net earnings per equivalent Class A common share................................ 598 681 744 772
(1) Includes realized investment gains, which, for any given period have no predictive value, and variations in amount from period to period
have no practical analytical value, particularly in view of the unrealized appreciation now existing in Berkshire’s consolidated investment
portfolio. After-tax realized investment gains for the periods presented above are as follows:
1st 2nd 3rd 4th
Quarter Quarter Quarter Quarter
Realized investment gains – 2003 ........................................................................ $526 $905 $453 $845
Realized investment gains – 2002 ........................................................................ 100 43 164 259