Berkshire Hathaway 2003 Annual Report Download - page 28
Download and view the complete annual report
Please find page 28 of the 2003 Berkshire Hathaway annual report below. You can navigate through the pages in the report by either clicking on the pages listed below, or by using the keyword search tool below to find specific information within the annual report.-
 1
1 -
2
-
3
-
4
-
5
-
6
-
7
-
8
-
9
-
10
-
11
-
12
-
13
-
14
-
15
-
16
-
17
-
 18
18 -
 19
19 -
 20
20 -
 21
21 -
 22
22 -
 23
23 -
 24
24 -
 25
25 -
 26
26 -
 27
27 -
 28
28 -
 29
29 -
 30
30 -
 31
31 -
 32
32 -
 33
33 -
 34
34 -
 35
35 -
 36
36 -
 37
37 -
 38
38 -
39
-
40
-
41
-
42
-
43
-
44
-
45
-
46
-
47
-
48
-
49
-
50
-
51
-
52
-
53
-
54
-
55
-
56
-
57
-
58
-
59
-
60
-
61
-
62
-
63
-
64
-
65
-
66
-
67
-
68
-
69
-
70
-
71
-
72
-
73
-
74
-
75
-
76
-
77
-
78
 |
 |

27
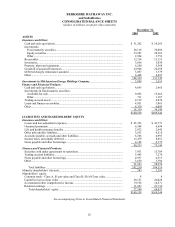
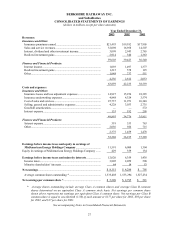
BERKSHIRE HATHAWAY INC.
and Subsidiaries
CONSOLIDATED STATEMENTS OF EARNINGS
(dollars in millions except per share amounts)
Year Ended December 31,
2003 2002 2001
Revenues:
Insurance and Other:
Insurance premiums earned.............................................................. $21,493 $19,182 $17,905
Sales and service revenues ............................................................... 32,098 16,958 14,507
Interest, dividend and other investment income ............................... 3,098 2,943 2,765
Realized investment gains ................................................................ 2,914 340 1,363
59,603 39,423 36,540
Finance and Financial Products:
Interest income ................................................................................. 1,093 1,497 1,377
Realized investment gains ................................................................ 1,215 578 125
Other................................................................................................. 1,948 737 551
4,256 2,812 2,053
63,859 42,235 38,593
Costs and expenses:
Insurance and Other:
Insurance losses and loss adjustment expenses ................................ 14,927 15,256 18,385
Insurance underwriting expenses...................................................... 4,848 4,324 3,574
Cost of sales and services................................................................. 25,737 11,971 10,340
Selling, general and administrative expenses ................................... 4,228 3,033 2,735
Goodwill amortization...................................................................... — — 572
Interest expense................................................................................ 153 192 205
49,893 34,776 35,811
Finance and Financial Products:
Interest expense................................................................................ 319 533 763
Other................................................................................................. 2,056 926 715
2,375 1,459 1,478
52,268 36,235 37,289
Earnings before income taxes and equity in earnings of
MidAmerican Energy Holdings Company................................... 11,591 6,000 1,304
Equity in earnings of MidAmerican Energy Holdings Company ....... 429 359 134
Earnings before income taxes and minority interests .................... 12,020 6,359 1,438
Income taxes..................................................................................... 3,805 2,059 590
Minority shareholders’ interests....................................................... 64 14 53
Net earnings ....................................................................................... $ 8,151 $ 4,286 $ 795
Average common shares outstanding *............................................ 1,535,405 1,533,294 1,527,234
Net earnings per common share *.................................................... $ 5,309 $ 2,795 $ 521
* Average shares outstanding include average Class A common shares and average Class B common
shares determined on an equivalent Class A common stock basis. Net earnings per common share
shown above represents net earnings per equivalent Class A common share. Net earnings per Class B
common share is equal to one-thirtieth (1/30) of such amount or $177 per share for 2003, $93 per share
for 2002, and $17 per share for 2001.
See accompanying Notes to Consolidated Financial Statements