Berkshire Hathaway 2003 Annual Report Download - page 18
Download and view the complete annual report
Please find page 18 of the 2003 Berkshire Hathaway annual report below. You can navigate through the pages in the report by either clicking on the pages listed below, or by using the keyword search tool below to find specific information within the annual report.-
 1
1 -
2
-
3
-
4
-
5
-
6
-
7
-
 8
8 -
 9
9 -
 10
10 -
 11
11 -
 12
12 -
 13
13 -
 14
14 -
 15
15 -
 16
16 -
 17
17 -
 18
18 -
 19
19 -
 20
20 -
 21
21 -
 22
22 -
 23
23 -
 24
24 -
 25
25 -
 26
26 -
 27
27 -
 28
28 -
29
-
30
-
31
-
32
-
33
-
34
-
35
-
36
-
37
-
38
-
39
-
40
-
41
-
42
-
43
-
44
-
45
-
46
-
47
-
48
-
49
-
50
-
51
-
52
-
53
-
54
-
55
-
56
-
57
-
58
-
59
-
60
-
61
-
62
-
63
-
64
-
65
-
66
-
67
-
68
-
69
-
70
-
71
-
72
-
73
-
74
-
75
-
76
-
77
-
78
 |
 |

17
point. This markup fairly compensates Berkshire for putting its exceptional creditworthiness
to work, but it still delivers money to Clayton at an attractive price.
In 2003, Berkshire did $2 billion of such borrowing and re-lending, with Clayton using much
of this money to fund several large purchases of portfolios from lenders exiting the business.
A portion of our loans to Clayton also provided “catch-up” funding for paper it had generated
earlier in the year from its own operation and had found difficult to securitize.
You may wonder why we borrow money while sitting on a mountain of cash. It’ s because of
our “every tub on its own bottom” philosophy. We believe that any subsidiary lending money
should pay an appropriate rate for the funds needed to carry its receivables and should not be
subsidized by its parent. Otherwise, having a rich daddy can lead to sloppy decisions.
Meanwhile, the cash we accumulate at Berkshire is destined for business acquisitions or for
the purchase of securities that offer opportunities for significant profit. Clayton’ s loan
portfolio will likely grow to at least $5 billion in not too many years and, with sensible credit
standards in place, should deliver significant earnings.
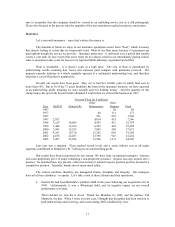
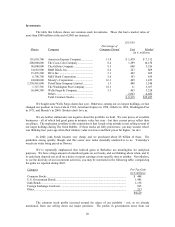
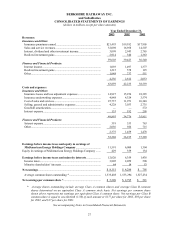
For simplicity’ s sake, we include all of Clayton’ s earnings in this sector, though a sizable
portion is derived from areas other than consumer finance.
(in $ millions)
Pre-Tax Earnings Interest-bearing Liabilities
2003 2002 2003 2002
Trading – Ordinary Income ........................... $ 379 $ 553 $7,826 $13,762
Gen Re Securities ........................................... (99) (173) 8,041* 10,631*
Life and annuity operation.............................. 99 83 2,331 1,568
Value Capital.................................................. 31 61 18,238* 20,359*
Berkadia ......................................................... 101 115 525 2,175
Leasing operations.......................................... 34 34 482 503
Manufactured housing finance (Clayton) ....... 37** —2,032 —
Other............................................................... 84 102 618 630
Income before capital gains............................ 666 775
Trading – Capital Gains.................................. 1,215 578 N.A. N.A.
Total ............................................................... $1,881 $1,353
* Includes all liabilities
** From date of acquisition, August 7, 2003
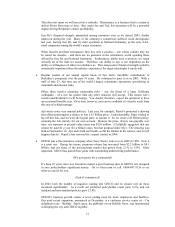
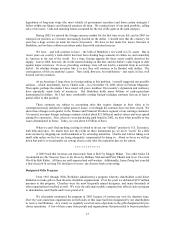
Manufacturing, Service and Retailing Operations
Our activities in this category cover the waterfront. But let’ s look at a simplified balance sheet
and earnings statement consolidating the entire group.
Balance Sheet 12/31/03 (in $ millions)
Assets Liabilities and Equity
Cash and equivalents ................................. $ 1,250 Notes payable ............................... $ 1,593
Accounts and notes receivable .................. 2,796 Other current liabilities................. 4,300
Inventory ................................................... 3,656 Total current liabilities ................. 5,893
Other current assets ................................... 262
Total current assets.................................... 7,964
Goodwill and other intangibles.................. 8,351 Deferred taxes............................... 105
Fixed assets ............................................... 5,898 Term debt and other liabilities...... 1,890
Other assets ............................................... 1,054 Equity ........................................... 15,379
$23,267 $23,267