Berkshire Hathaway 2003 Annual Report Download - page 59
Download and view the complete annual report
Please find page 59 of the 2003 Berkshire Hathaway annual report below. You can navigate through the pages in the report by either clicking on the pages listed below, or by using the keyword search tool below to find specific information within the annual report.-
 1
1 -
2
-
3
-
4
-
5
-
6
-
7
-
8
-
9
-
10
-
11
-
12
-
13
-
14
-
15
-
16
-
17
-
18
-
19
-
20
-
21
-
22
-
23
-
24
-
25
-
26
-
27
-
28
-
29
-
30
-
31
-
32
-
33
-
34
-
35
-
36
-
37
-
38
-
39
-
40
-
41
-
42
-
43
-
44
-
45
-
46
-
47
-
48
-
 49
49 -
 50
50 -
 51
51 -
 52
52 -
 53
53 -
 54
54 -
 55
55 -
 56
56 -
 57
57 -
 58
58 -
 59
59 -
 60
60 -
 61
61 -
 62
62 -
 63
63 -
 64
64 -
 65
65 -
 66
66 -
 67
67 -
 68
68 -
 69
69 -
70
-
71
-
72
-
73
-
74
-
75
-
76
-
77
-
78
 |
 |

58
Management’s Discussion (Continued)
Insurance — Underwriting (Continued)
Berkshire Hathaway Reinsurance Group (Continued)
share arrangement, BHRG essentially participates proportionately in the premiums and claims of the business
written by the ceding company. BHRG was willing to enter into these new contracts because it believed the level of
rate adequacy in certain property/casualty markets was much improved in relation to past years. BHRG’ s
participation in the Lloyd’ s business declined in 2003 as the availability of other sources of capacity for Lloyd’ s
syndicates increased.
Berkshire Hathaway Primary Group
Berkshire’ s primary insurance group consists of a wide variety of smaller insurance businesses that
principally write liability coverages for commercial accounts. These businesses include: National Indemnity
Company’ s primary group operation (“NICO Primary Group”), a writer of motor vehicle and general liability
coverages; U.S. Investment Corporation (“USIC”), whose subsidiaries underwrite specialty insurance coverages; a
group of companies referred to internally as “Homestate” operations, providers of standard multi-line insurance; and
Central States Indemnity Company, a provider of credit and disability insurance to individuals nationwide through
financial institutions.
Collectively, Berkshire’ s other primary insurance businesses produced earned premiums of $1,034 million
in 2003, $712 million in 2002, and $501 million in 2001. The increases in premiums earned during the past two
years were largely attributed to increased volume at USIC and the NICO Primary Group. Net underwriting gains of
Berkshire’ s other primary insurance businesses totaled $74 million in 2003, $32 million in 2002, and $30 million in
2001. The improvement in year-to-year comparative underwriting results was due to the aforementioned increases
in premiums and reasonably good claim experience.
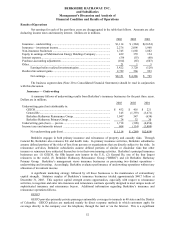
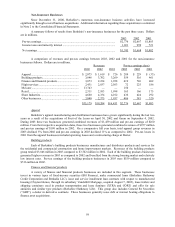
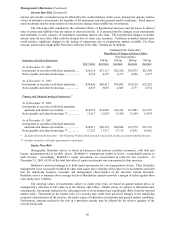
Insurance — Investment Income
Following is a summary of the net investment income of Berkshire’ s insurance operations for the past three
years. Dollars are in millions.
2003 2002 2001
Investment income before taxes............................................................................. $3,223 $3,050 $2,824
Applicable income taxes and minority interest ...................................................... 947 954 856
Investment income after taxes and minority interest.............................................. $2,276 $2,096 $1,968
Investment income from insurance operations in 2003 of $3,223 million increased 5.7% over 2002, which
exceeded 2001 by 8.0%. The increase in 2003 investment income was due primarily to higher amounts of interest
earned from high-yield corporate obligations, partially offset by the effects of lower interest rates for other fixed
maturity obligations. Berkshire’ s investments in high-yield corporate bonds were approximately $8 billion (at
original cost) as of December 31, 2002. As of December 31, 2003 the cost of such investments declined about $1.5
billion, as a result of sales and prepayments by issuers.
The high-yield investments were primarily acquired at distressed prices. The credit risk associated with
such investments is much greater than with other fixed maturity investments typically acquired by Berkshire, which
are generally U.S. Government, municipal and mortgage-backed securities and short-term cash equivalents. As of
December 31, 2003, approximately 65% of Berkshire’ s high-yield investments were issued by companies in the
energy industry. While the market prices of such investments increased significantly for all major positions during
2003, Berkshire management does not believe that the credit risks associated with the issuers of these instruments
has correspondingly declined. Credit losses may eventually occur with respect to some of these investments.
However, management also believes that over time these investments will produce reasonable returns in relation to
credit risk.
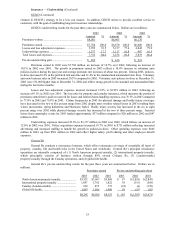
Invested assets of insurance businesses increased during 2003 by $14.5 billion to $93.5 billion at
December 31, 2003 following an increase of $7 billion during 2002. The increase in invested assets during 2003
was primarily the result of the market price appreciation of Berkshire’ s major equity investments and high-yield
fixed maturity investments, as well as strong operating cash flow.
Float represents an estimate of the amount of funds ultimately payable to policyholders that is available for
investment. Total float at December 31, 2003 was approximately $44.2 billion compared to $41.2 billion at
December 31, 2002 and about $35.5 billion at December 31, 2001. The cost of float, represented by the ratio of the
pre-tax underwriting gain or loss over average float, was negative for 2003 due to $1.7 billion of pre-tax net
underwriting gains. The cost of float in 2002 was about 1.1% as compared to 12.8% for 2001.