Berkshire Hathaway 2003 Annual Report Download - page 61
Download and view the complete annual report
Please find page 61 of the 2003 Berkshire Hathaway annual report below. You can navigate through the pages in the report by either clicking on the pages listed below, or by using the keyword search tool below to find specific information within the annual report.-
 1
1 -
2
-
3
-
4
-
5
-
6
-
7
-
8
-
9
-
10
-
11
-
12
-
13
-
14
-
15
-
16
-
17
-
18
-
19
-
20
-
21
-
22
-
23
-
24
-
25
-
26
-
27
-
28
-
29
-
30
-
31
-
32
-
33
-
34
-
35
-
36
-
37
-
38
-
39
-
40
-
41
-
42
-
43
-
44
-
45
-
46
-
47
-
48
-
49
-
50
-
 51
51 -
 52
52 -
 53
53 -
 54
54 -
 55
55 -
 56
56 -
 57
57 -
 58
58 -
 59
59 -
 60
60 -
 61
61 -
 62
62 -
 63
63 -
 64
64 -
 65
65 -
 66
66 -
 67
67 -
 68
68 -
 69
69 -
 70
70 -
 71
71 -
72
-
73
-
74
-
75
-
76
-
77
-
78
 |
 |

60
Management’s Discussion (Continued)
Non-Insurance Businesses (Continued)
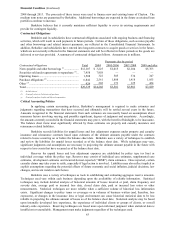
Finance and financial products (Continued)
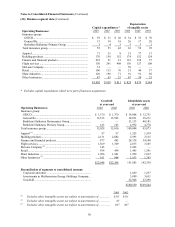
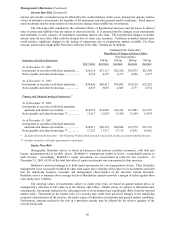
Revenues of the finance group consist of interest, rentals, and sales of manufactured homes, transportation
equipment and furniture. Revenues in 2003 totaled $3,073 million, an increase of 37.6% over 2002. The increase
in 2003 was primarily due to the inclusion of Clayton (approximately $500 million), revenues from the issuance of
annuity products of approximately $700 million versus none in 2002 and was partially offset by lower interest
income.
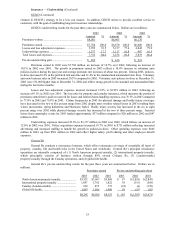
Pre-tax earnings of the finance group in 2003, which exclude realized investment gains, declined $107
million (14.7%) from 2002. Much of the comparative decline in pre-tax earnings was due to lower net interest
earned by BH Finance. BH Finance’ s fixed maturity investment portfolio declined about $6 billion during 2003 as
a result of sales and prepayments and was offset by corresponding declines in repurchase agreement obligations.
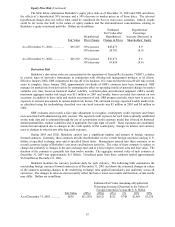
During 2003, pre-tax earnings included about $101 million from Berkadia as compared to $115 million in
2002. Earnings of Berkadia are directly correlated with the outstanding amount of a term loan to FINOVA, which
totaled $525 million at December 31, 2003 compared to $2.175 billion at December 31, 2002 and $4.9 billion at
December 31, 2001. Most of Berkadia’ s pre-tax earnings in 2003 were represented by the accelerated recognition
in earnings of fees received in 2001 from FINOVA in connection with origination of the loan as a result of loan
repayments being at a much faster rate than originally anticipated. In February 2004, the FINOVA loan was repaid
in full. Thus, earnings from Berkadia in 2004 will be nominal.
GRS had a pre-tax loss in 2003 of $99 million versus a loss of $173 million in 2002. GRS’ s operation has
been in run-off since January 2002. During the run-off period, GRS has limited new business to certain risk
management transactions and is unwinding existing asset and liability positions in an orderly manner. Since the
run-off commenced, approximately two-thirds of GRS’ s open trades have been terminated. It is expected that the
run-off will take at least several more years to complete. The pre-tax losses in the last two years reflect related run-
off costs as well as net transaction and position losses. Additional losses will almost certainly be incurred over time
in connection with the run-off. The timing and amounts of such losses is uncertain.
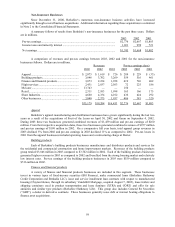
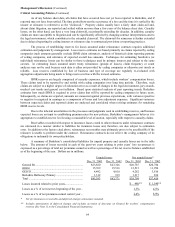
Flight services
This segment includes FlightSafety, a leading provider of high technology training to operators of aircraft
and ships and NetJets, the world’ s leading provider of fractional ownership programs for general aviation aircraft.
FlightSafety’ s worldwide clients include corporations, regional airlines, the military and government agencies. The
decline in revenues was split between FlightSafety (about $96 million) and NetJets (about $310 million). A decline
in FlightSafety training revenues accounted for most of that businesses revenue decline. The decline in training
revenues was due to a decline in regional airline training somewhat offset by increased U.S. Government training
revenues. The decline in revenues at NetJets was due to a reduction of revenues from sales of aircraft of $514
million partially offset by increased flight services and other revenues of about $204 million. Pre-tax earnings from
these businesses was $72 million in 2003 as compared to $225 million in 2002. The results for 2002 include a gain
of $60 million from the sale of a partnership interest to Boeing and the results for 2003 include the recognition of
pre-tax charges of $69 million related to write downs of certain simulators and aircraft inventory. Excluding the
aforementioned gain and write downs, “normal earnings” from these businesses were $141 million in 2003 versus
$165 million in 2002. The reduction in combined “normal” pre-tax earnings from these businesses is due to
reduced “normal” pre-tax earnings at FlightSafety of $34 million somewhat offset by improved results at NetJets
where its pre-tax loss before write downs was $9 million in 2003 versus about $19 million in 2002. The corporate
aviation business has slowed significantly in the past few years which has hurt FlightSafety’ s results. NetJets
continues to be the leader in the fractional ownership field.
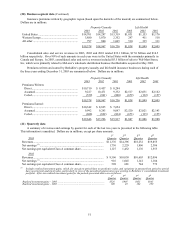
McLane
On May 23, 2003, Berkshire acquired McLane Company, Inc. from Wal-Mart Stores, Inc. Results of
McLane’ s business operations are included in Berkshire’ s consolidated results beginning on that date. McLane’ s
revenues were $13,743 million and pre-tax earnings totaled $150 million for the period from May 23 to December
31. Approximately 35% of McLane’ s revenues derived from sales to Wal-Mart Stores, Inc. McLane’ s business is
marked by high sales volume and low profit margins. For its most recently completed fiscal year prior to the
acquisition, McLane’ s sales and pre-tax earnings totaled approximately $21.9 billion and $220 million, respectively.
See Note 2 to the Consolidated Financial Statements for information regarding the acquisition and McLane’ s
business.