Berkshire Hathaway 2003 Annual Report Download - page 38
Download and view the complete annual report
Please find page 38 of the 2003 Berkshire Hathaway annual report below. You can navigate through the pages in the report by either clicking on the pages listed below, or by using the keyword search tool below to find specific information within the annual report.-
 1
1 -
2
-
3
-
4
-
5
-
6
-
7
-
8
-
9
-
10
-
11
-
12
-
13
-
14
-
15
-
16
-
17
-
18
-
19
-
20
-
21
-
22
-
23
-
24
-
25
-
26
-
27
-
 28
28 -
 29
29 -
 30
30 -
 31
31 -
 32
32 -
 33
33 -
 34
34 -
 35
35 -
 36
36 -
 37
37 -
 38
38 -
 39
39 -
 40
40 -
 41
41 -
 42
42 -
 43
43 -
 44
44 -
 45
45 -
 46
46 -
 47
47 -
 48
48 -
49
-
50
-
51
-
52
-
53
-
54
-
55
-
56
-
57
-
58
-
59
-
60
-
61
-
62
-
63
-
64
-
65
-
66
-
67
-
68
-
69
-
70
-
71
-
72
-
73
-
74
-
75
-
76
-
77
-
78
 |
 |

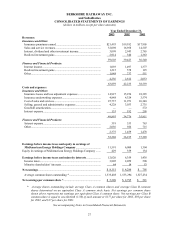
37
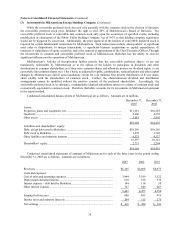
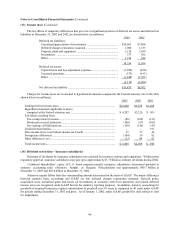
(4) Investments in fixed maturity securities
Investments in securities with fixed maturities as of December 31, 2003 and 2002 are shown below (in millions).
A
mortized Unrealized Unrealized
F
ai
r
Cos
t
Gains Losses Value
December 31, 2003
Insurance and other:
Obligations of U.S. Treasury, U.S. government
corporations and agencies ............................................... $ 2,019 $ 95 $ (5) $ 2,109
Obligations of states, municipalities
and political subdivisions ................................................ 4,659 241 —4,900
Obligations of foreign governments ...................................... 4,986 80 (26) 5,040
Corporate bonds and redeemable preferred stock.................. 8,677 2,472 (23) 11,126
Mortgage-backed securities ................................................... 2,802 145 (6) 2,941
$23,143 $3,033 $ (60) $26,116
Finance and financial products, available-for-sale:
Obligations of U.S. Treasury, U.S. government
corporations and agencies ............................................... $ 3,733 $ 320 $ — $ 4,053
Corporate bonds ..................................................................... 704 79 —783
Mortgage-backed securities ................................................... 4,076 180 — 4,256
$ 8,513 $ 579 $ — $ 9,092
Mortgage-backed securities, held-to-maturity....................... $ 563 $ 105 $ — $ 668
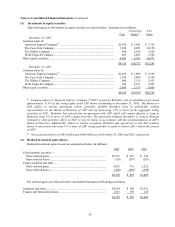
A
mortized Unrealized Unrealized
F
ai
r
December 31
,
2002 Cos
t
Gains Losses Value
Insurance and other:
Obligations of U.S. Treasury, U.S. government
corporations and agencies ............................................... $ 9,091 $ 966 $ — $10,057
Obligations of states, municipalities
and political subdivisions ................................................ 6,346 280 (1) 6,625
Obligations of foreign governments ...................................... 3,813 92 (2) 3,903
Corporate bonds and redeemable preferred stocks ................ 10,120 1,041 (118) 11,043
Mortgage-backed securities ................................................... 6,155 321 (8) 6,468
$35,525 $2,700 $ (129) $38,096
Finance and financial products, available-for-sale:
Obligations of U.S. Treasury, U.S. government
corporations and agencies ............................................... $ 3,543 $ 331 $ — $ 3,874
Corporate bonds ..................................................................... 1,261 40 (10) 1,291
Mortgage-backed securities ................................................... 10,202 299 — 10,501
$15,006 $ 670 $ (10) $15,666
Mortgage-backed securities, held-to-maturity....................... $ 1,019 $ 178 $ — $ 1,197
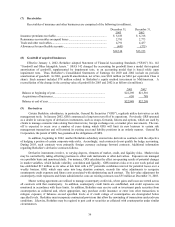
Shown below are the amortized cost and estimated fair values of securities with fixed maturities at
December 31, 2003, by contractual maturity dates. Actual maturities will differ from contractual maturities because
issuers of certain of the securities retain early call or prepayment rights. Amounts are in millions.
Amortized Fair
Cost Value
Due in 2004 ................................................................................................................. $ 4,105 $ 4,217
Due 2005 – 2008 ......................................................................................................... 7,914 8,656
Due 2009 – 2013 ......................................................................................................... 8,590 10,018
Due after 2014............................................................................................................. 4,169 5,120
24,778 28,011
Mortgage-backed securities......................................................................................... 7,441 7,865
$32,219 $35,876