Berkshire Hathaway 2003 Annual Report Download - page 41
Download and view the complete annual report
Please find page 41 of the 2003 Berkshire Hathaway annual report below. You can navigate through the pages in the report by either clicking on the pages listed below, or by using the keyword search tool below to find specific information within the annual report.-
 1
1 -
2
-
3
-
4
-
5
-
6
-
7
-
8
-
9
-
10
-
11
-
12
-
13
-
14
-
15
-
16
-
17
-
18
-
19
-
20
-
21
-
22
-
23
-
24
-
25
-
26
-
27
-
28
-
29
-
30
-
 31
31 -
 32
32 -
 33
33 -
 34
34 -
 35
35 -
 36
36 -
 37
37 -
 38
38 -
 39
39 -
 40
40 -
 41
41 -
 42
42 -
 43
43 -
 44
44 -
 45
45 -
 46
46 -
 47
47 -
 48
48 -
 49
49 -
 50
50 -
 51
51 -
52
-
53
-
54
-
55
-
56
-
57
-
58
-
59
-
60
-
61
-
62
-
63
-
64
-
65
-
66
-
67
-
68
-
69
-
70
-
71
-
72
-
73
-
74
-
75
-
76
-
77
-
78
 |
 |

40
Notes to Consolidated Financial Statements (Continued)
(9) Derivatives (Continued)
At December 31, 2003, Berkshire subsidiaries accepted collateral with a fair value of $1,220 million to secure
unrealized gains on derivatives. Of the securities held as collateral, approximately $31 million were repledged as of
December 31, 2003. At December 31, 2003, securities with a fair value of approximately $441 million (which includes
$31 million of repledged securities as described above) were pledged against derivative liabilities with a fair value of
$733 million. Contractual terms with counterparties often require additional collateral to be posted immediately in the
event of a decline in the financial rating of the counterparty or its guarantor.
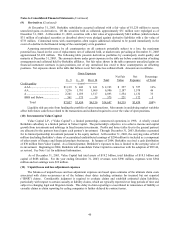
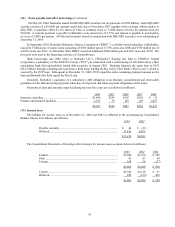
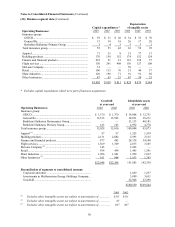
Assuming non-performance by all counterparties on all contracts potentially subject to a loss, the maximum
potential loss, based on the cost of replacement, net of collateral held, at market rates prevailing at December 31, 2003
approximated $3,439 million. The following table presents derivatives portfolios by counterparty credit quality and
maturity at December 31, 2003. The amounts shown under gross exposure in the table are before consideration of netting
arrangements and collateral held by Berkshire affiliates. Net fair value shown in the table represents unrealized gains on
financial instrument contracts in gain positions, net of any unrealized loss owed to these counterparties on offsetting
positions. Net exposure shown in the table that follows is net fair value less collateral held. Amounts are in millions.
Gross Exposure
Net Fair Net Percentage
0 – 5 6 – 10 Over 10 Total Value Exposure of Total
Credit quality (years)
AAA ....................................... $1,119 $ 443 $ 631 $ 2,193 $ 557 $ 557 16%
AA.......................................... 3,236 1,781 1,969 6,986 2,187 1,578 46
A............................................. 2,341 1,035 1,517 4,893 1,554 1,132 33
BBB and Below...................... 361 175 39 575 221 172 5
Total $7,057 $3,434 $4,156 $14,647 $4,519 $3,439 100%
Liquidity risk can arise from funding the portfolio of open transactions. Movements in underlying market variables
affect both future cash flows related to the transactions and collateral required to cover the value of open positions.
(10) Investment in Value Capital
Value Capital L.P., (“Value Capital”), a limited partnership, commenced operations in 1998. A wholly owned
Berkshire subsidiary is a limited partner in Value Capital. The partnership’ s objective is to achieve income and capital
growth from investments and arbitrage in fixed income investments. Profits and losses (after fees to the general partner)
are allocated to the partners based upon each partner’ s investment. Through December 31, 2003, Berkshire accounted
for its limited partnership investment pursuant to the equity method. At December 31, 2003, the carrying value of $634
million (including Berkshire’ s share of accumulated undistributed earnings of $204 million) is included as a component
of other assets of finance and financial products businesses. In January of 2004, Berkshire received a cash distribution
of $30 million from Value Capital. As a limited partner, Berkshire’ s exposure to loss is limited to the carrying value of
its investment. Beginning in 2004, Berkshire will consolidate Value Capital in connection with the adoption of FIN 46,
as revised. See Note 1 (r) for additional information.
As of December 31, 2003, Value Capital had total assets of $19.2 billion, total liabilities of $18.5 billion and
capital of $688 million. For the year ending December 31, 2003, revenues were $596 million, expenses were $564
million and net earnings were $32 million.
(11) Unpaid losses and loss adjustment expenses
The balances of unpaid losses and loss adjustment expenses are based upon estimates of the ultimate claim costs
associated with claim occurrences as of the balance sheet dates including estimates for incurred but not reported
(“IBNR”) claims. Considerable judgment is required to evaluate claims and establish estimated claim liabilities,
particularly with respect to certain casualty or liability claims, which are typically reported over long periods of time and
subject to changing legal and litigation trends. This delay in claim reporting is exacerbated in reinsurance of liability or
casualty claims as claim reporting by ceding companies is further delayed by contract terms.