Berkshire Hathaway 2003 Annual Report Download - page 29
Download and view the complete annual report
Please find page 29 of the 2003 Berkshire Hathaway annual report below. You can navigate through the pages in the report by either clicking on the pages listed below, or by using the keyword search tool below to find specific information within the annual report.-
 1
1 -
2
-
3
-
4
-
5
-
6
-
7
-
8
-
9
-
10
-
11
-
12
-
13
-
14
-
15
-
16
-
17
-
18
-
 19
19 -
 20
20 -
 21
21 -
 22
22 -
 23
23 -
 24
24 -
 25
25 -
 26
26 -
 27
27 -
 28
28 -
 29
29 -
 30
30 -
 31
31 -
 32
32 -
 33
33 -
 34
34 -
 35
35 -
 36
36 -
 37
37 -
 38
38 -
 39
39 -
40
-
41
-
42
-
43
-
44
-
45
-
46
-
47
-
48
-
49
-
50
-
51
-
52
-
53
-
54
-
55
-
56
-
57
-
58
-
59
-
60
-
61
-
62
-
63
-
64
-
65
-
66
-
67
-
68
-
69
-
70
-
71
-
72
-
73
-
74
-
75
-
76
-
77
-
78
 |
 |

28
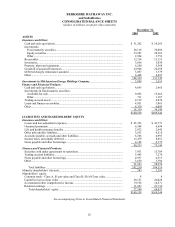
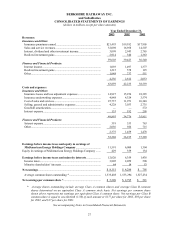
BERKSHIRE HATHAWAY INC.
and Subsidiaries
CONSOLIDATED STATEMENTS OF CASH FLOWS
(dollars in millions)
Year Ended December 31,
2003 2002 2001
Cash flows from operating activities:
Net earnings................................................................................................ $ 8,151 $ 4,286 $ 795
Adjustments to reconcile net earnings to cash flows
from operating activities:
Realized investment gains .......................................................................... (4,129) (918) (1,488)
Depreciation and amortization.................................................................... 520 520 945
Changes in assets and liabilities before effects from
business acquisitions:
Losses and loss adjustment expenses....................................................... 397 3,209 7,571
Deferred charges reinsurance assumed .................................................... 292 (147) (498)
Unearned premiums................................................................................. (585) 1,880 929
Receivables .............................................................................................. 2,018 (896) 219
Accounts payable, accruals and other liabilities ...................................... (907) 1,062 (339)
Finance businesses operating activities.................................................... 1,558 2,940 (1,083)
Income taxes ............................................................................................ 505 195 (329)
Other........................................................................................................... 437 (996) (148)
Net cash flows from operating activities .................................................... 8,257 11,135 6,574
Cash flows from investing activities:
Purchases of securities with fixed maturities.............................................. (9,924) (16,288) (16,475)
Purchases of equity securities..................................................................... (1,842) (1,756) (1,075)
Proceeds from sales of securities with fixed maturities.............................. 17,650 9,108 8,427
Proceeds from redemptions and maturities of securities
with fixed maturities ................................................................................ 9,847 6,740 4,305
Proceeds from sales of equity securities..................................................... 3,159 1,340 3,881
Loans and investments originated in finance businesses............................ (3,046) (2,281) (9,502)
Principal collection on loans and investments
originated in finance businesses............................................................... 4,241 5,226 4,126
Acquisitions of businesses, net of cash acquired........................................ (3,213) (2,620) (4,697)
Other........................................................................................................... (759) (780) (684)
Net cash flows from investing activities..................................................... 16,113 (1,311) (11,694)
Cash flows from financing activities:
Proceeds from borrowings of finance businesses....................................... 2,479 211 6,288
Proceeds from other borrowings................................................................. 822 1,472 824
Repayments of borrowings of finance businesses ...................................... (2,260) (3,802) (865)
Repayments of other borrowings................................................................ (783) (774) (798)
Change in short term borrowings of finance businesses............................. (63) (1,207) 794
Changes in other short term borrowings..................................................... (642) 380 (345)
Other........................................................................................................... (714) 146 116
Net cash flows from financing activities .................................................... (1,161) (3,574) 6,014
Increase in cash and cash equivalents......................................................... 23,209 6,250 894
Cash and cash equivalents at beginning of year............................................... 12,748 6,498 5,604
Cash and cash equivalents at end of year *.................................................. $35,957 $12,748 $ 6,498
* Cash and cash equivalents at end of year are comprised of the following:
Insurance and Other................................................................................... $31,262 $10,283 $ 5,313
Finance and Financial Products................................................................ 4,695 2,465 1,185
$35,957 $12,748 $ 6,498
See accompanying Notes to Consolidated Financial Statements