Berkshire Hathaway 2003 Annual Report Download - page 39
Download and view the complete annual report
Please find page 39 of the 2003 Berkshire Hathaway annual report below. You can navigate through the pages in the report by either clicking on the pages listed below, or by using the keyword search tool below to find specific information within the annual report.-
 1
1 -
2
-
3
-
4
-
5
-
6
-
7
-
8
-
9
-
10
-
11
-
12
-
13
-
14
-
15
-
16
-
17
-
18
-
19
-
20
-
21
-
22
-
23
-
24
-
25
-
26
-
27
-
28
-
 29
29 -
 30
30 -
 31
31 -
 32
32 -
 33
33 -
 34
34 -
 35
35 -
 36
36 -
 37
37 -
 38
38 -
 39
39 -
 40
40 -
 41
41 -
 42
42 -
 43
43 -
 44
44 -
 45
45 -
 46
46 -
 47
47 -
 48
48 -
 49
49 -
50
-
51
-
52
-
53
-
54
-
55
-
56
-
57
-
58
-
59
-
60
-
61
-
62
-
63
-
64
-
65
-
66
-
67
-
68
-
69
-
70
-
71
-
72
-
73
-
74
-
75
-
76
-
77
-
78
 |
 |

38
Notes to Consolidated Financial Statements (Continued)
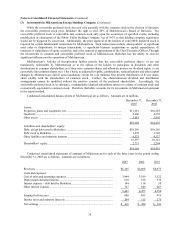
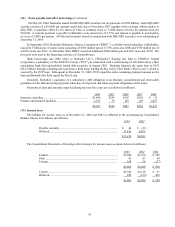
(5) Investments in equity securities
Data with respect to investments in equity securities are shown below. Amounts are in millions.
Unrealized Fair
Cost Gains(2) Value
December 31, 2003
Common stock of:
American Express Company(1) ............................................................................. $1,470 $ 5,842 $ 7,312
The Coca-Cola Company ..................................................................................... 1,299 8,851 10,150
The Gillette Company .......................................................................................... 600 2,926 3,526
Wells Fargo & Company...................................................................................... 463 2,861 3,324
Other equity securities............................................................................................. 4,683 6,292 10,975
$8,515 $26,772 $35,287
December 31, 2002
Common stock of:
American Express Company(1) ............................................................................. $1,470 $ 3,889 $ 5,359
The Coca-Cola Company ..................................................................................... 1,299 7,469 8,768
The Gillette Company .......................................................................................... 600 2,315 2,915
Wells Fargo & Company...................................................................................... 306 2,191 2,497
Other equity securities............................................................................................. 5,489 3,335 8,824
$9,164 $19,199 $28,363
(1) Common shares of American Express Company ("AXP") owned by Berkshire and its subsidiaries possessed
approximately 11.8% of the voting rights of all AXP shares outstanding at December 31, 2003. The shares are
held subject to various agreements which, generally, prohibit Berkshire from (i) unilaterally seeking
representation on the Board of Directors of AXP and (ii) possessing 17% or more of the aggregate voting
securities of AXP. Berkshire has entered into an agreement with AXP which will remain effective so long as
Berkshire owns 5% or more of AXP's voting securities. The agreement obligates Berkshire, so long as Kenneth
Chenault is chief executive officer of AXP, to vote its shares in accordance with the recommendations of AXP's
Board of Directors. Additionally, subject to certain exceptions, Berkshire has agreed not to sell AXP common
shares to any person who owns 5% or more of AXP voting securities or seeks to control AXP, without the consent
of AXP.
(2) Net of unrealized losses of $65 million and $406 million as of December 31, 2003 and 2002, respectively.
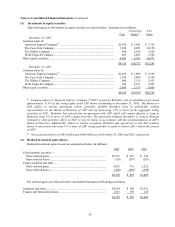
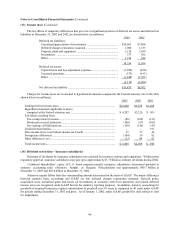
(6) Realized investment gains (losses)
Realized investment gains (losses) are summarized below (in millions).
2003 2002 2001
Fixed maturity securities —
Gross realized gains ................................................................................. $2,715 $ 997 $ 536
Gross realized losses ................................................................................ (129) (287) (201)
Equity securities and other —
Gross realized gains ................................................................................. 2,033 791 1,522
Gross realized losses ................................................................................ (490) (583) (369)
$4,129 $ 918 $1,488
Net realized gains are reflected in the Consolidated Statements of Earnings as follows.
Insurance and other...................................................................................... $2,914 $ 340 $1,363
Finance and financial products .................................................................... 1,215 578 125
$4,129 $ 918 $1,488